
 資料結構
資料結構 網路
網路 關係型資料庫管理系統
 作業系統
作業系統 Java
Java iOS
iOS HTML
HTML CSS
CSS Android
 Python
 C 程式設計
 C++
C++ C#
C# MongoDB
 MySQL
MySQL Javascript
 PHP
PHPPython Pandas - 使用 Seaborn 繪製小提琴圖並設定四分位數為水平線
Seaborn 中的小提琴圖用於繪製箱線圖和核密度估計的組合。使用 seaborn.violinplot() 函式。使用 **inner** 引數並將其值設定為 **quartile** 來將四分位數設定為水平線。
假設以下資料是 CSV 檔案格式的資料集:Cricketers.csv
首先,匯入所需的庫:
import seaborn as sb
import pandas as pd
import matplotlib.pyplot as plt
將資料從 CSV 檔案載入到 Pandas DataFrame 中:
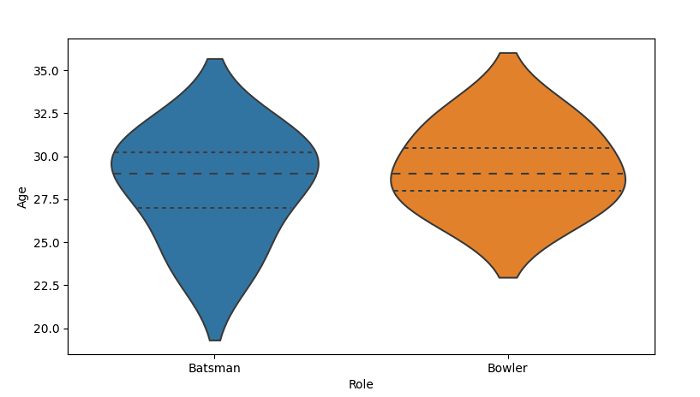
dataFrame = pd.read_csv("C:\Users\amit_\Desktop\Cricketers.csv")繪製帶有 Role 和 Age 的小提琴圖。透過傳遞顯式順序(即基於“Role”排序)來控制箱的順序。使用 inner 引數並將其值設定為 quartile 來將四分位數設定為水平線:
sb.violinplot(x = 'Role', y = "Age", order=["Batsman", "Bowler"], data = dataFrame, inner="quartile")
示例
以下是程式碼:
import seaborn as sb
import pandas as pd
import matplotlib.pyplot as plt

# Load data from a CSV file into a Pandas DataFrame:
dataFrame = pd.read_csv("C:\Users\amit_\Desktop\Cricketers.csv")

# plotting violin plot with Role and Age
# Control box order by passing an explicit order i.e. ordering on the basis of "Role"
# quartiles as horizontal lines using the inner parameter with value quartile
sb.violinplot(x = 'Role', y = "Age", order=["Batsman", "Bowler"], data = dataFrame, inner="quartile")

# display
plt.show()
輸出
這將生成以下輸出:

更新於: 2021年9月27日
466 次檢視

廣告