
 資料結構
資料結構 網路
網路 關係型資料庫管理系統
 作業系統
作業系統 Java
Java iOS
iOS HTML
HTML CSS
CSS Android
 Python
 C 程式設計
 C++
C++ C#
C# MongoDB
 MySQL
MySQL Javascript
 PHP
PHP如何在 OpenCV Python 中繪製圖像不同顏色的直方圖?
在 OpenCV 中計算直方圖,我們使用cv2.calcHist()函式。在本教程中,我們將展示如何計算輸入影像不同顏色(藍色、綠色和紅色)的直方圖。
要計算和繪製圖像不同顏色的直方圖,可以按照以下步驟操作:
步驟
匯入所需的庫OpenCV和matplotlib。確保您已安裝它們。
import cv2
import matplotlib.pyplot as plt
使用cv2.imread()方法讀取影像。影像的寬度和高度必須相同。
img1 = cv2.imread('birds.jpg')
計算輸入影像不同顏色(藍色、綠色和紅色)的直方圖。
hist1 = cv2.calcHist([img],[0],None,[256],[0,256]) #blue
hist2 = cv2.calcHist([img],[1],None,[256],[0,256]) # green
hist3 = cv2.calcHist([img],[2],None,[256],[0,256]) # red
繪製輸入影像不同顏色的直方圖。
plt.subplot(3,1,1), plt.plot(hist1, color='b')
plt.subplot(3,1,2), plt.plot(hist2, color='g')
plt.subplot(3,1,3), plt.plot(hist2, color='r')
輸入影像
我們將在下面的示例中使用以下影像作為輸入檔案。

示例 1
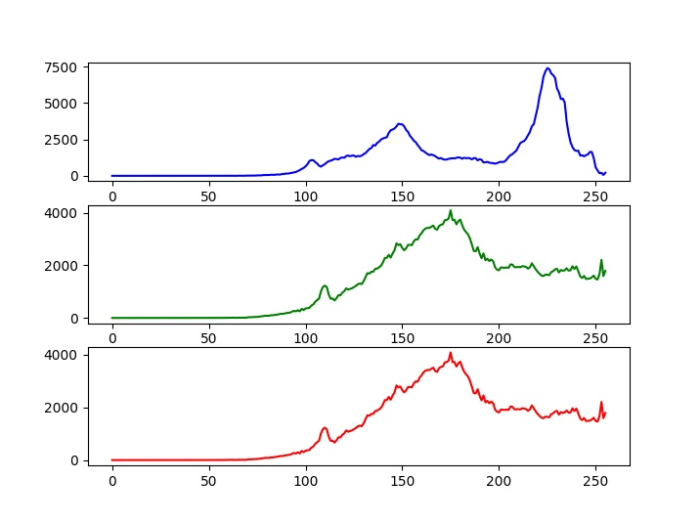
在本例中,我們計算三種不同顏色(藍色、綠色和紅色)的直方圖,並在三個子圖中繪製所有三個直方圖。
# import required libraries
import cv2
from matplotlib import pyplot as plt

# Read the input image
img = cv2.imread('birds.jpg')

# calculate the histogram for Blue, green ,Red color channels
hist1 = cv2.calcHist([img],[0],None,[256],[0,256]) #blue
hist2 = cv2.calcHist([img],[1],None,[256],[0,256]) # green
hist3 = cv2.calcHist([img],[2],None,[256],[0,256]) # red

# plot the histogram
plt.subplot(3,1,1), plt.plot(hist1, color='b')
plt.subplot(3,1,2), plt.plot(hist2, color='g')
plt.subplot(3,1,3), plt.plot(hist2, color='r')
plt.show()
輸出
執行此 Python 程式碼時,將產生以下輸出:
示例 2
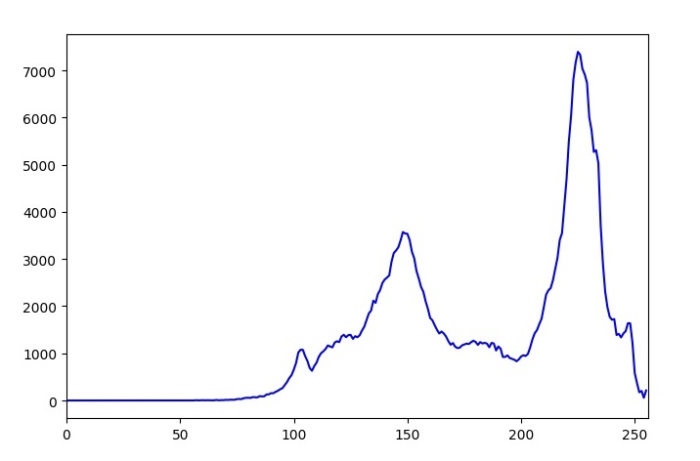
在本例中,我們計算三種不同顏色(藍色、綠色和紅色)的直方圖,並在單個圖中繪製所有三個直方圖。
# import required libraries
import cv2
from matplotlib import pyplot as plt

# Read the input image
img = cv2.imread('birds.jpg')

# define the color
color = ('b','g','r')

# calculate and plot the histogram
for i, col in enumerate(color):
   histr = cv2.calcHist([img],[i],None,[256],[0,256])
   plt.plot(histr,color = col)
   plt.xlim([0,256])
plt.show()
執行此程式碼時,將產生以下輸出視窗:

更新於: 2022-09-27
1K+ 瀏覽量

廣告