
 資料結構
資料結構 網路
網路 關係資料庫管理系統 (RDBMS)
 作業系統
作業系統 Java
Java iOS
iOS HTML
HTML CSS
CSS Android
 Python
 C語言程式設計
 C++
C++ C#
C# MongoDB
 MySQL
MySQL Javascript
 PHP
PHP如何使用Python在OpenCV中調整影像大小?
OpenCV 提供了函式 cv2.resize() 來調整影像大小。在OpenCV中,調整大小被稱為縮放。我們可以透過指定影像大小或縮放因子來調整影像大小。當我們指定縮放因子時,縱橫比會得到保留。
cv2.resize() 函式使用了不同的插值方法:
cv2.INTER_AREA - 用於縮小影像。
cv2.INTER_CUBIC - 速度較慢,用於放大。
cv2.INTER_LINEAR - 用於放大。它是所有調整大小目的的預設值。
步驟
您可以使用以下步驟來調整影像大小:
匯入所需的庫。在以下所有Python示例中,所需的Python庫是OpenCV和Matplotlib。請確保您已經安裝了它們。
import cv2
import matplotlib.pyplot as plt
使用cv2.imread()函式讀取影像。使用影像型別(.jpg或.png)指定完整的影像路徑。
img = cv2.imread('birds.jpg')
傳遞new_size或縮放因子fx和fy以及插值來調整影像大小。fx和fy分別是寬度和高度的縮放因子。
resize_img = cv2.resize(img, new_size)
resize_img = cv2.resize(img,(0, 0),fx=0.5, fy=0.7, interpolation = cv2.INTER_AREA)
顯示調整大小後的影像。
plt.imshow(resize_img)
讓我們藉助一些Python示例來了解不同的影像大小調整選項。
在以下示例中,我們將使用此影像作為輸入檔案:

示例1
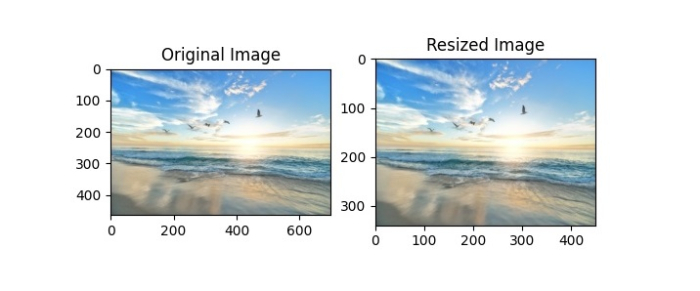
在下面的Python程式中,我們將輸入影像調整為new_size = 450, 340)。這裡寬度=450,高度=340。
import cv2
import matplotlib.pyplot as plt

img = cv2.imread('birds.jpg')
h, w, c = img.shape
print(f"Height and width of original image: {h}, {w}" )

# resize the image
new_size = (450, 340) # new_size=(width, height)
print(f"New height and width: {new_size[1]}, {new_size[0]}" )
resize_img = cv2.resize(img, new_size)

# Convert the images from BGR to RGB
img = cv2.cvtColor(img, cv2.COLOR_BGR2RGB)
resize_img = cv2.cvtColor(resize_img, cv2.COLOR_BGR2RGB)

plt.subplot(121),plt.imshow(img), plt.title("Original Image")
plt.subplot(122), plt.imshow(resize_img), plt.title("Resized Image")
plt.show()
輸出
執行上述程式後,將產生以下輸出:
Height and width of original image: 465, 700
New height and width of original image: 340, 450
並且它將顯示以下輸出視窗,顯示原始影像和調整大小後的影像。
示例2
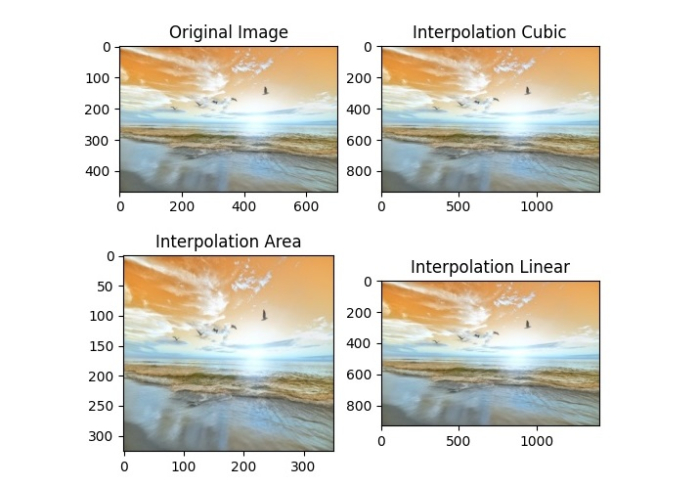
在下面的Python程式中,我們將使用不同的縮放因子和插值來調整輸入影像的大小。
# import the required libraries
import cv2
import matplotlib.pyplot as plt

# read the input image
img = cv2.imread('birds.jpg')

# resize the image using different interpolations
resize_cubic = cv2.resize(img,(0, 0),fx=2, fy=2, interpolation = cv2.INTER_CUBIC)
resize_area = cv2.resize(img,(0, 0),fx=0.5, fy=0.7, interpolation = cv2.INTER_AREA)
resize_linear = cv2.resize(img,(0, 0),fx=2, fy=2, interpolation = cv2.INTER_LINEAR)

# display the original and resized images
plt.subplot(221),plt.imshow(img), plt.title("Original Image")
plt.subplot(222), plt.imshow(resize_cubic), plt.title("Interpolation Cubic")
plt.subplot(223), plt.imshow(resize_area), plt.title("Interpolation Area")
plt.subplot(224), plt.imshow(resize_linear), plt.title("Interpolation Linear")
plt.show()
輸出
執行上述程式後,將產生以下輸出:

更新於:2022年9月27日
11K+ 次瀏覽

廣告