
 資料結構
資料結構 網路
網路 關係資料庫管理系統 (RDBMS)
 作業系統
作業系統 Java
Java iOS
iOS HTML
HTML CSS
CSS Android
 Python
 C 語言程式設計
 C++
C++ C#
C# MongoDB
 MySQL
MySQL Javascript
 PHP
PHP如何在 OpenCV 中使用 Python 在影像上繪製多邊形?
要在影像上繪製多邊形,我們使用 `cv2.polylines()` 方法。我們可以在影像上繪製開放或封閉的多邊形。繪製開放多邊形時,首尾兩點不會連線。
語法
`cv2.polylines()` 的語法如下:
cv2.polylines(src, [pts], isClosed, color, thickness)
引數
**src** - 要繪製多邊形的輸入影像。
**pts** - 點的陣列列表。
**isClosed** - 設定為 `isClosed=True` 繪製封閉多邊形,對於開放多邊形,設定為 `isClosed=False`。
**color** - 線條的顏色。
**thickness** - 線條的粗細。預設粗細設定為 `thickness=1`。
步驟
您可以按照以下步驟在影像上繪製多邊形:
匯入所需的庫。在以下所有 Python 示例中,所需的 Python 庫是 **OpenCV** 和 **NumPy**。確保您已經安裝了它們。
import cv2
import numpy as np
使用 `cv2.imread()` 方法讀取輸入影像。
img = cv2.imread('nature_waterfall.jpg')
定義點的二維陣列並將其重新整形。
points = np.array([[155,320],[250,420],[345,50]])
pts = points.reshape(-1,1,2) # now shape [3,1,2]
在影像上繪製多邊形,傳遞引數的所需值:`isClosed`、`color`、`thickness`。要繪製封閉多邊形,請傳遞 `isClosed=True`;要繪製開放多邊形,請設定 `isClosed=False`。
cv2.polylines(img, [pts1], isClosed=True, color=(255,0,0), thickness = 2)
顯示繪製了多邊形的影像。
cv2.imshow("Polylines", img_poly)
cv2.waitKey(0)
cv2.destroyAllWindows()
在以下示例中,我們將使用此影像作為 **輸入檔案**。

示例 1
在下面的 Python 程式中,我們在輸入影像上繪製了一條藍色封閉多邊形。
# import required libraries
import cv2
import numpy as np

# load the input image
img = cv2.imread('nature_waterfall.jpg')

# define an array of three points on image to draw the polylines
# shape of point array [3,2]
points = np.array([[155,320],[250,420],[345,50]])

# reshape the point array to make it 3D
pts = points.reshape(-1,1,2) # now shape [3,1,2]

# draw polylines on the image, passing desired values of the arguments
img_poly = cv2.polylines(img, [pts], isClosed=True, color=(255,0,0), thickness = 2)

# display the image with drawn polylines
cv2.imshow("Polylines", img_poly)
cv2.waitKey(0)
cv2.destroyAllWindows()
輸出
執行上述程式後,將生成以下 **輸出** 視窗。
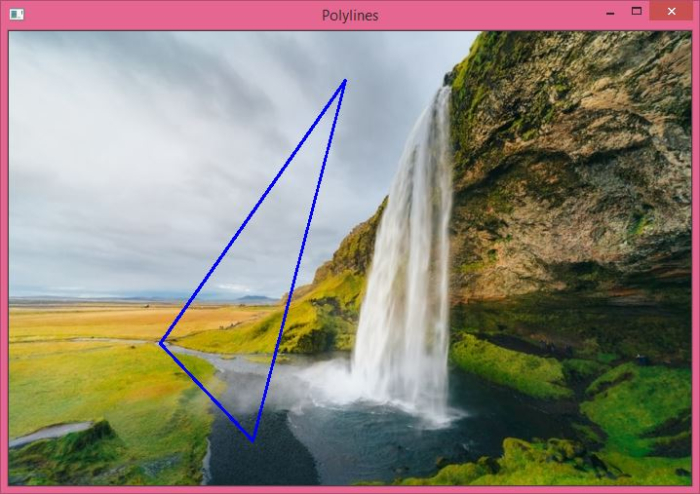
請注意,影像上繪製的多邊形是封閉的。我們可以繪製一個未封閉的多邊形。在這種情況下,首尾兩點不會連線。請檢視第二個示例,瞭解影像上繪製的兩種型別的線條。
示例 2
在下面的 Python 程式中,我們在輸入影像上繪製了三條多邊形。第一條和第三條多邊形是封閉的,而第二條多邊形是開放的。
import cv2
import numpy as np
# read the input image
img = cv2.imread('nature_waterfall.jpg')

# define the array of points
points1 = np.array([[455,200],[155,420],[145,350]])
points2 = np.array([[200,120],[200,320],[405,350], [600,30]])
points3 = np.array([[100,20],[320,20],[45,350], [100,150]])

# reshape the points
pts1 = points1.reshape(-1,1,2)
pts2 = points2.reshape(-1,1,2)
pts3 = points3.reshape(-1,1,2)

# draw the polylines
cv2.polylines(img, [pts1], isClosed=True, color=(255,0,0), thickness = 2)
cv2.polylines(img, [pts2], isClosed=False, color=(0,255,0), thickness = 2)
cv2.polylines(img, [pts3], isClosed=True, color=(0,0,255), thickness = 2)

# display the image with drawn polylines
cv2.imshow("Polylines", img)
cv2.waitKey(0)
cv2.destroyAllWindows()
輸出
執行上述程式後,將生成以下 **輸出** 視窗。
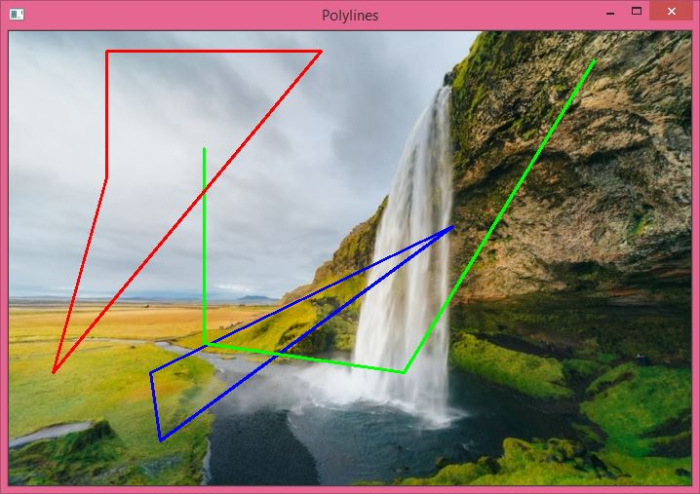
請注意,綠色多邊形是開放的,而紅色和藍色多邊形是封閉的。

5K+ 次瀏覽
