
 資料結構
資料結構 網路
網路 關係資料庫管理系統(RDBMS)
 作業系統
作業系統 Java
Java iOS
iOS HTML
HTML CSS
CSS Android
 Python
 C語言程式設計
 C++
C++ C#
C# MongoDB
 MySQL
MySQL Javascript
 PHP
PHPOpenCV Python – 如何在影像上查詢並繪製物體的極值點?
為了找到並在輸入影像中繪製物體的極值點,我們可以按照以下步驟操作:
第一步是匯入所需的庫。在以下所有 Python 示例中,所需的 Python 庫是 **OpenCV**。確保您已安裝它。
下一步是使用 **cv2.imread()** 函式讀取輸入影像。使用影像型別(.jpg 或 .png)指定完整的影像路徑。將輸入影像轉換為灰度影像。
對灰度影像應用閾值處理以建立二值影像。調整第二個引數以獲得更好的輪廓檢測效果。
ret,thresh = cv2.threshold(gray,150,255,0)
使用 **cv2.findContours()** 函式查詢影像中的輪廓。
contours, _ = cv2.findContours(thresh, cv2.RETR_TREE, cv2.CHAIN_APPROX_SIMPLE)
從輪廓列表中選擇一個輪廓(例如第一個輪廓)**cnt**。或者遍歷所有輪廓。
查詢極值點:最左、最右、最上和最下。
leftmost = tuple(cnt[cnt[:,:,0].argmin()][0])
rightmost = tuple(cnt[cnt[:,:,0].argmax()][0])
topmost = tuple(cnt[cnt[:,:,1].argmin()][0])
bottommost = tuple(cnt[cnt[:,:,1].argmax()][0])
在影像上繪製這些極值點。要在影像上繪製一個點,我們繪製一個半徑很小的填充圓。
顯示繪製了輪廓和近似輪廓的影像。
讓我們透過一些 Python 示例來了解如何在影像中查詢和繪製物體的極值點。
示例
下面的 Python 3 程式演示瞭如何在影像中查詢和繪製物體的極值點。
# import required libraries
import cv2

# load the input image
img = cv2.imread('four-point-star.png')

# convert the input image to grayscale
gray = cv2.cvtColor(img, cv2.COLOR_BGR2GRAY)

# apply thresholding to convert grayscale to binary image
ret,thresh = cv2.threshold(gray,150,255,0)

# find the contours
contours,hierarchy = cv2.findContours(thresh,
cv2.RETR_TREE,cv2.CHAIN_APPROX_SIMPLE)
print("Number of contours detected:", len(contours))

# select the first contour
cnt = contours[0]

# find the extreme points
leftmost = tuple(cnt[cnt[:,:,0].argmin()][0])
rightmost = tuple(cnt[cnt[:,:,0].argmax()][0])
topmost = tuple(cnt[cnt[:,:,1].argmin()][0])
bottommost = tuple(cnt[cnt[:,:,1].argmax()][0])
points = [leftmost, rightmost, topmost, bottommost]

# draw the points on th image
for point in points:
   cv2.circle(img, point, 4, (0, 0, 255), -1)

# display the image with drawn extreme points
while True:
   cv2.imshow("Extreme Points", img)
   if cv2.waitKey(1) & 0xFF == 27:
      break
cv2.destroyAllWindows()
我們將使用以下影像作為此程式的輸入檔案:

輸出
執行上述程式碼後,將產生以下輸出:
Number of contours detected: 1
我們將得到以下顯示輸出的視窗:
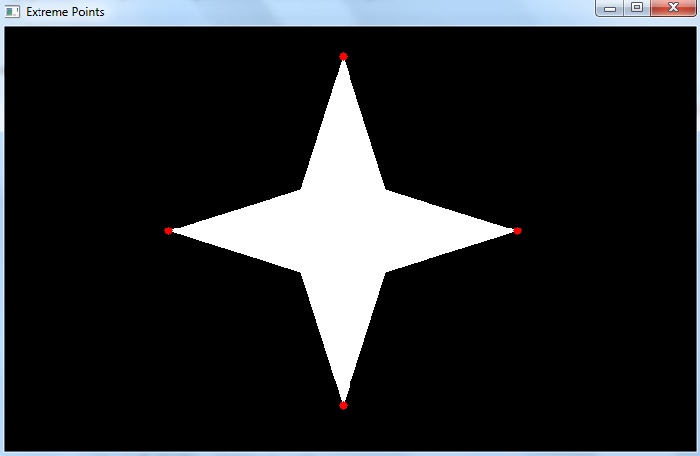
請注意,最左、最右、最上和最下的四個極值點以紅色繪製。
示例
在這個 Python 程式中,我們繪製了輸入影像中物體的極值點。
# import required libraries
import cv2

# load the input image
img = cv2.imread('two-shapes.png')

# convert the input image to grayscale
gray = cv2.cvtColor(img, cv2.COLOR_BGR2GRAY)

# apply thresholding to convert grayscale to binary image
ret,thresh = cv2.threshold(gray,150,255,0)

# find the contours
contours,hierarchy = cv2.findContours(thresh,
cv2.RETR_TREE,cv2.CHAIN_APPROX_SIMPLE)
print("Number of contours detected:", len(contours))

# loop over all the contours
for cnt in contours:
   # extreme points
   leftmost = tuple(cnt[cnt[:,:,0].argmin()][0])
   rightmost = tuple(cnt[cnt[:,:,0].argmax()][0])
   topmost = tuple(cnt[cnt[:,:,1].argmin()][0])
   bottommost = tuple(cnt[cnt[:,:,1].argmax()][0])
   points = [leftmost, rightmost, topmost, bottommost]

   # draw the points on th image
   for point in points:
      cv2.circle(img, point, 4, (0, 0, 255), -1)

# display the image with drawn extreme points
while True:
   cv2.imshow("Extreme Points", img)
   if cv2.waitKey(1) & 0xFF == 27:
      break
cv2.destroyAllWindows()
我們將使用以下影像作為此程式的**輸入檔案**:

輸出
執行上述程式碼後,將產生以下輸出:
Number of contours detected: 2
我們將得到以下顯示輸出的視窗:
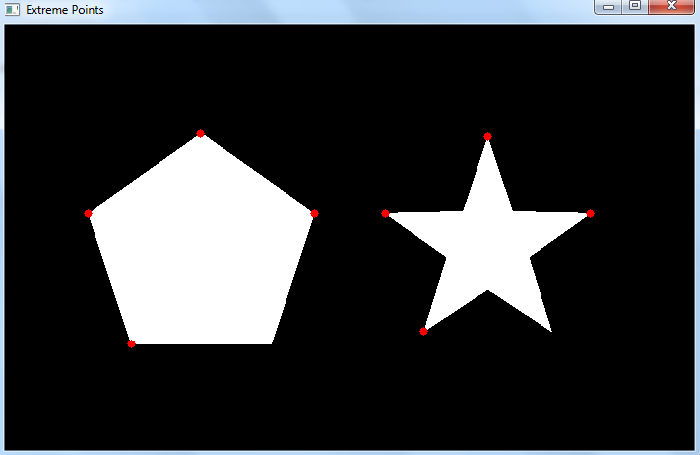
請注意,最左、最右、最上和最下的四個極值點以紅色繪製。在上面的輸出中,繪製了兩個不同物體(形狀)的極值點。

更新於:2022年12月2日
2K+ 瀏覽量

廣告