
 資料結構
資料結構 網路
網路 關係資料庫管理系統 (RDBMS)
 作業系統
作業系統 Java
Java iOS
iOS HTML
HTML CSS
CSS Android
 Python
 C語言程式設計
 C++
C++ C#
C# MongoDB
 MySQL
MySQL Javascript
 PHP
PHPOpenCV Python – 如何計算和繪製圖像區域的直方圖?
在 OpenCV 中,我們使用 `cv2.calcHist()` 函式來計算影像的直方圖。我們可以使用此函式來計算影像區域的直方圖。要計算影像中某個區域的直方圖,首先我們定義一個掩碼。掩碼中的白色表示要檢查原始輸入影像中的區域,而掩碼影像中的黑色表示要忽略的區域。現在我們計算直方圖,並將此掩碼作為引數傳遞給函式。
步驟
要計算和繪製圖像區域的直方圖,可以按照以下步驟操作:
匯入所需的庫 **OpenCV、NumPy** 和 **matplotlib。** 請確保您已經安裝了它們。
使用 `cv2.imread()` 方法讀取輸入影像。指定影像的完整路徑。
為我們的影像定義一個掩碼。掩碼影像中的黑色表示要忽略的區域,白色表示要檢查原始輸入影像中的區域。
使用 `cv2.split()` 函式分割輸入影像的不同通道(藍色、綠色和紅色)。
使用上面定義的掩碼計算輸入影像不同通道的直方圖。繪製輸入影像不同顏色的直方圖。
hist = cv2.calcHist([channel], [0], mask, [256], [0, 256])
要視覺化輸入影像的掩碼區域,請對輸入影像與掩碼影像執行 `cv2.bitwise_and()` 操作。它會建立一個輸入影像的掩碼區域。
讓我們看一些例子,以便更好地理解這個問題。
輸入
我們在下面的示例中使用以下影像作為輸入檔案。
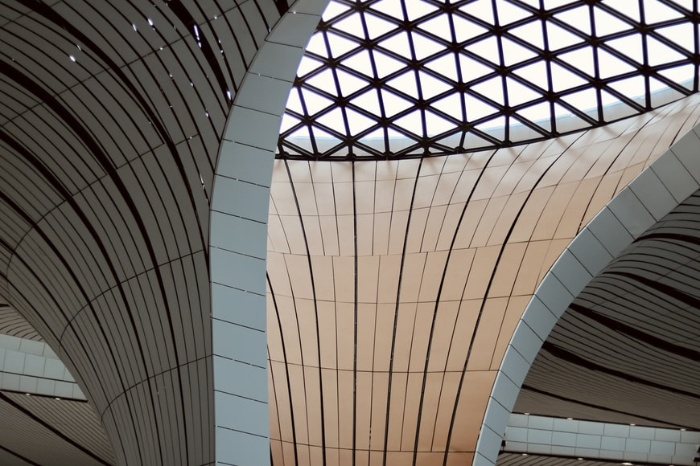
示例
在此示例中,我們計算輸入影像矩形區域的直方圖並繪製直方圖。
# import required libraries
import cv2
from matplotlib import pyplot as plt
import numpy as np

# Read the input image
img = cv2.imread('architecture2.jpg')

# define a function to compute and plot histogram
def plot_histogram(img, title, mask=None):
   # split the image into blue, green and red channels
   channels = cv2.split(img)
   colors = ("b", "g", "r")
   plt.title(title)
   plt.xlabel("Bins")
   plt.ylabel("# of Pixels")
   # loop over the image channels
   for (channel, color) in zip(channels, colors):
      # compute the histogram for the current channel and plot it
      hist = cv2.calcHist([channel], [0], mask, [256], [0, 256])
      plt.plot(hist, color=color)
      plt.xlim([0, 256])

# define a mask for our image; black for regions to ignore

# and white for regions to examine
mask = np.zeros(img.shape[:2], dtype="uint8")
cv2.rectangle(mask, (160, 130), (410, 290), 255, -1)

# display the masked region
masked = cv2.bitwise_and(img, img, mask=mask)

# compute a histogram for masked image
plot_histogram(img, "Histogram for Masked Image", mask=mask)

# show the plots
plt.show()
cv2.imshow("Mask", mask)
cv2.imshow("Mask Image", masked)
cv2.waitKey(0)
輸出
執行上述 Python 程式時,它會生成以下輸出視窗:
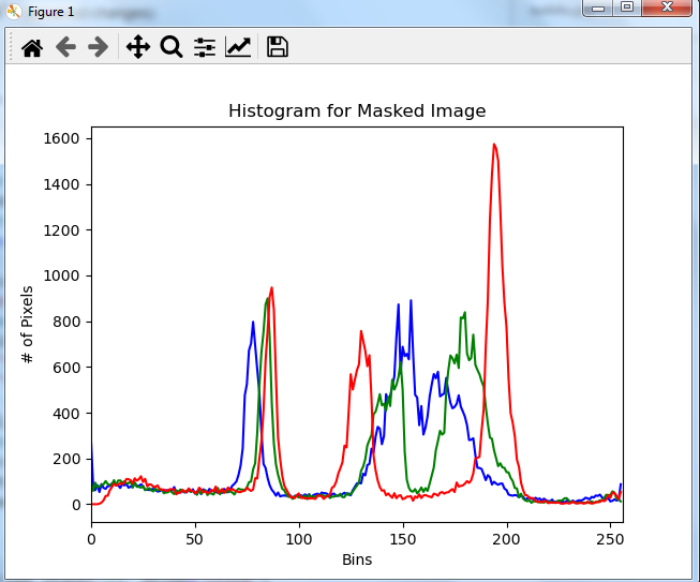
上述輸出影像顯示了輸入影像中矩形區域的直方圖。

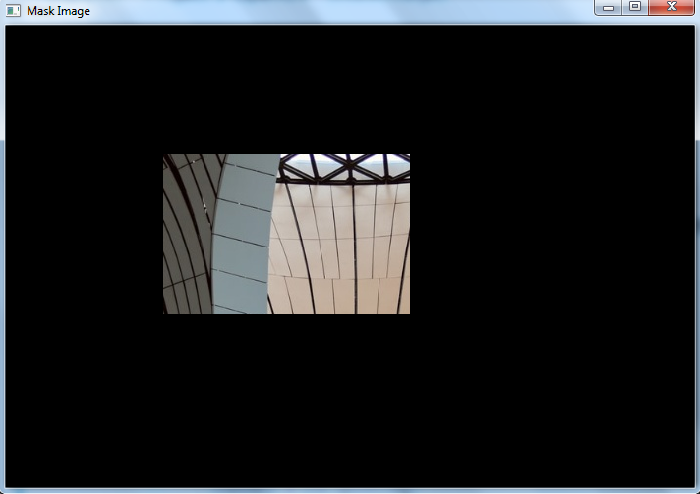
上述兩張輸出影像是輸入影像的掩碼和矩形區域。直方圖僅針對此掩碼區域計算。

更新於:2022年12月2日
3K+ 次瀏覽

廣告