
 資料結構
資料結構 網路
網路 關係型資料庫管理系統
 作業系統
作業系統 Java
Java iOS
iOS HTML
HTML CSS
CSS Android
 Python
 C 程式設計
 C++
C++ C#
C# MongoDB
 MySQL
MySQL Javascript
 PHP
PHP如何在 OpenCV Python 中計算和繪製圖像的二維直方圖?
我們可以應用cv2.calcHist()函式來計算影像的二維直方圖。彩色影像具有三個通道 - 紅色、綠色和藍色。我們可以一次計算兩個顏色通道的二維直方圖。因此,我們有三種顏色通道組合,每次取兩個 - 紅色和綠色(或綠色和紅色)、綠色和藍色(或藍色和綠色)以及藍色和紅色(或紅色和藍色)。
步驟
要計算和繪製輸入影像的二維直方圖,可以按照以下步驟操作 -
匯入所需的庫OpenCV和matplotlib。確保您已安裝它們。
使用cv2.imread()方法讀取輸入影像。指定影像的完整路徑。
使用cv2.split()函式將輸入影像拆分為相應的藍色、綠色和紅色通道。
blue, green, red = cv2.split(img)
一次計算兩個顏色通道的二維彩色直方圖。計算三個顏色通道所有三種組合的二維直方圖。要計算綠色和藍色通道的二維直方圖,我們應用以下程式碼片段。
hist = cv2.calcHist([green, blue], [0, 1], None, [32, 32],[0, 256, 0, 256])
繪製上面計算出的二維直方圖。
讓我們看一些例子,以便更好地理解這個問題。
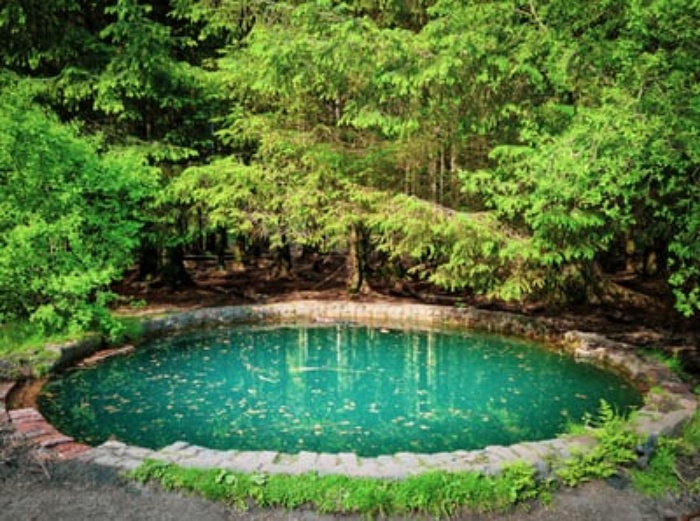
我們在下面的示例中使用以下影像作為輸入檔案。
示例
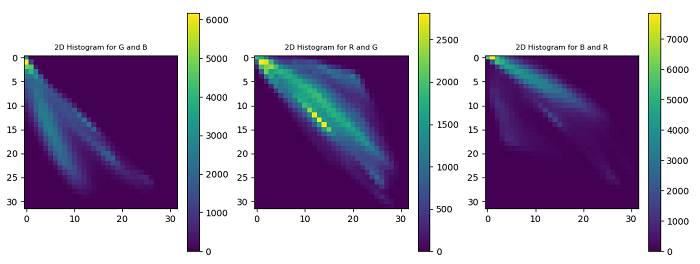
在這個 Python 程式中,我們計算並繪製輸入影像的三種組合(藍色和綠色、綠色和紅色以及紅色和藍色)顏色的二維直方圖。
# import required libraries
import cv2
from matplotlib import pyplot as plt

# Read the input image
img = cv2.imread('blue-pool.jpg')

# split the image into the respective channels Blue, Green and Red
blue, green, red = cv2.split(img)

# 2D color histogram for the

# green and blue channels
plt.subplot(131)
hist1 = cv2.calcHist([green, blue], [0, 1], None, [32, 32],[0, 256, 0, 256])
p = plt.imshow(hist1, interpolation="nearest")
plt.title("2D Histogram for G and B", fontsize=8)
plt.colorbar(p)

# 2D color histogram for the red and green channels
plt.subplot(132)
hist2 = cv2.calcHist([red, green], [0, 1], None, [32, 32],[0, 256, 0, 256])
p = plt.imshow(hist2, interpolation="nearest")
plt.title("2D Histogram for R and G", fontsize=8)
plt.colorbar(p)

# 2D color histogram for the blue and red channels
plt.subplot(133)
hist3 = cv2.calcHist([blue, red], [0, 1], None, [32, 32],[0, 256, 0, 256])
p = plt.imshow(hist3, interpolation="nearest")
plt.title("2D Histogram for B and R", fontsize=8)
plt.colorbar(p)
plt.show()
執行上述程式時,將生成以下輸出視窗,顯示輸入影像的二維直方圖。

更新於: 2022年12月2日
664 次瀏覽

廣告