
 資料結構
資料結構 網路
網路 關係型資料庫管理系統
 作業系統
作業系統 Java
Java iOS
iOS HTML
HTML CSS
CSS Android
 Python
 C 程式設計
 C++
C++ C#
C# MongoDB
 MySQL
MySQL Javascript
 PHP
PHP如何使用 Bokeh 顯示具有不同圖例的字形曲線?
Bokeh 是一個有助於資料視覺化的 Python 包。它是一個開源專案。Bokeh 使用 HTML 和 JavaScript 渲染其繪圖。這表明它在處理基於 Web 的儀表板時非常有用。
Bokeh 將資料來源轉換為 JSON 檔案。此檔案用作 BokehJS 的輸入,BokehJS 是一個 JavaScript 庫。此 BokehJS 使用 TypeScript 編寫,有助於在現代瀏覽器上渲染視覺化效果。
Matplotlib 和 Seaborn 生成靜態繪圖,而 Bokeh 生成互動式繪圖。這意味著當用戶與這些繪圖互動時,它們會相應地發生變化。
繪圖可以嵌入為 Flask 或 Django 啟用的 Web 應用程式的輸出。Jupyter notebook 也可以用來渲染這些繪圖。
Bokeh 的依賴項 -
Numpy
Pillow
Jinja2
Packaging
Pyyaml
Six
Tornado
Python−dateutil
在 Windows 命令提示符下安裝 Bokeh
pip3 install bokeh
在 Anaconda 提示符下安裝 Bokeh
conda install bokeh
以下是一個示例 -
示例
from bokeh.plotting import figure, output_file, show
import numpy as np
import math
x = np.arange(0, math.pi*3.5, 0.09)
fig = figure()
fig.line(x, np.sin(x),line_width = 2, line_color = 'navy', legend = 'sine')
fig.circle(x,np.cos(x), line_width = 2, line_color = 'orange', legend = 'cosine')
fig.square(x,np.tan(x),line_width = 2, line_color = 'cyan', legend = 'tan')
show(fig)
輸出
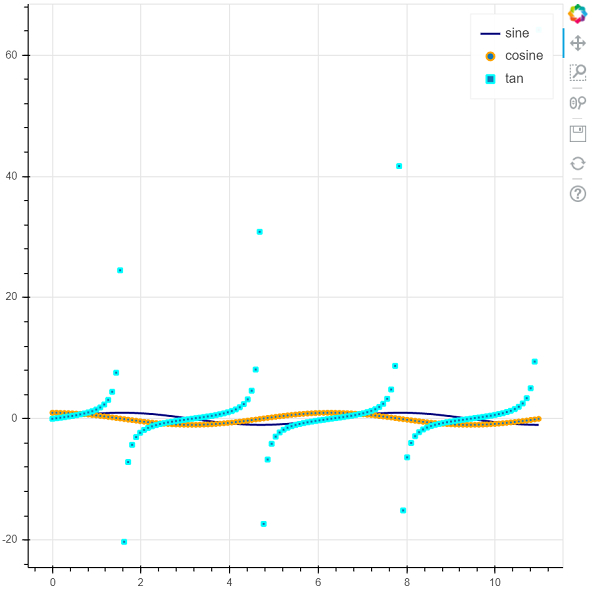
解釋
匯入併為所需的包設定別名。
呼叫 figure 函式。
NumPy 中的 'arange' 函式用於生成資料。
呼叫 'output_file' 函式以指定將生成的 html 檔案的名稱。
呼叫 Bokeh 中的 'line'、'circle' 和 'square' 函式以及資料。
使用 'show' 函式顯示繪圖。

更新於: 2021-01-19
63 次檢視

廣告