
 資料結構
資料結構 網路
網路 關係資料庫管理系統 (RDBMS)
 作業系統
作業系統 Java
Java iOS
iOS HTML
HTML CSS
CSS Android
 Python
 C 程式設計
 C++
C++ C#
C# MongoDB
 MySQL
MySQL Javascript
 PHP
PHP如何使用 Matplotlib Python 中的 `imshow` 函式顯示簡單的二元分佈?
Matplotlib 是一個流行的 Python 資料視覺化包。資料視覺化是一個關鍵步驟,因為它有助於理解資料中的情況,而無需實際檢視數字並進行復雜的計算。
它有助於有效地向受眾傳達定量見解。Matplotlib 用於建立具有資料的二維圖。它帶有一個面向物件的 API,有助於將繪圖嵌入 Python 應用程式中。Matplotlib 可與 IPython shell、Jupyter notebook、Spyder IDE 等一起使用。
它是用 Python 編寫的。它是使用 NumPy 建立的,NumPy 是 Python 中的數值 Python 包。
可以使用以下命令在 Windows 上安裝 Python:
pip install matplotlib
Matplotlib 的依賴項為:
Python ( greater than or equal to version 3.4)
NumPy
Setuptools
Pyparsing
Libpng
Pytz
Free type
Six
Cycler
Dateutil
二元分佈是指存在兩個獨立隨機變數時某個事件發生的機率。
`imshow` 函式通常用於在 Matplotlib 中顯示影像以及繪圖。
讓我們瞭解如何使用 Matplotlib 繪製二元分佈:
示例
import numpy as np
import matplotlib.cm as cm
import matplotlib.pyplot as plt
import matplotlib.cbook as cbook
from matplotlib.path import Path
from matplotlib.patches import PathPatch
np.random.seed(9654241)
delta = 0.025
x = y = np.arange(−4.5, 4.5, delta)
X, Y = np.meshgrid(x, y)
Z1 = np.exp(−X**2 − Y**2)
Z2 = np.exp(−(X − 1)**2 − (Y − 1)**2)
Z = (Z1 − Z2) * 2
fig, ax = plt.subplots()
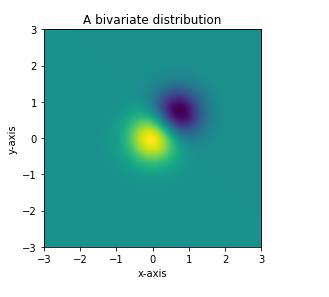
plt.title('A bivariate distribution')
plt.xlabel('x−axis')
plt.ylabel('y−axis')
im = ax.imshow(Z, interpolation='bilinear',
origin='lower', extent=[−3, 3, −3, 3],
vmax=abs(Z).max(), vmin=−abs(Z).max())
plt.show()輸出
解釋
匯入所需的包並定義其別名以方便使用。
使用 `random` 庫的 `seed` 函式建立資料。
使用 `Numpy` 庫為兩個不同的資料集建立資料。
使用 `figure` 函式建立一個空圖。
使用 `subplot` 函式在同一圖中建立 2 個單獨的繪圖。
使用 `plot` 函式繪製資料。
使用 `set_xlabel`、`set_ylabel` 和 `set_title` 函式為 X 軸、Y 軸和標題提供標籤。
使用 `imshow` 函式將圖形分配給變數。
使用 `show` 函式在控制檯中顯示它。

更新於:2021年1月18日
406 次檢視

廣告