- ggplot2 教程
- ggplot2 - 首頁
- ggplot2 - 簡介
- ggplot2 - R 的安裝
- ggplot2 - R 中的預設繪圖
- ggplot2 - 座標軸的使用
- ggplot2 - 圖例的使用
- ggplot2 - 散點圖 & 抖動圖
- ggplot2 - 條形圖 & 直方圖
- ggplot2 - 餅圖
- ggplot2 - 邊緣圖
- ggplot2 - 氣泡圖 & 計數圖
- ggplot2 - 發散型圖表
- ggplot2 - 主題
- ggplot2 - 多面板圖
- ggplot2 - 多個圖
- ggplot2 - 背景顏色
- ggplot2 - 時間序列
- ggplot2 有用資源
- ggplot2 - 快速指南
- ggplot2 - 有用資源
- ggplot2 - 討論
ggplot2 - 圖例的使用
座標軸和圖例統稱為引導。它們允許我們從圖中讀取觀測值,並將其映射回原始值。圖例鍵和刻度標籤都由刻度斷點確定。圖例和座標軸根據繪圖所需的相應刻度和幾何圖形自動生成。
我們將執行以下步驟來了解 ggplot2 中圖例的工作原理:
在工作區中包含包和資料集
讓我們建立相同的繪圖,以關注使用 ggplot2 生成的圖的圖例:
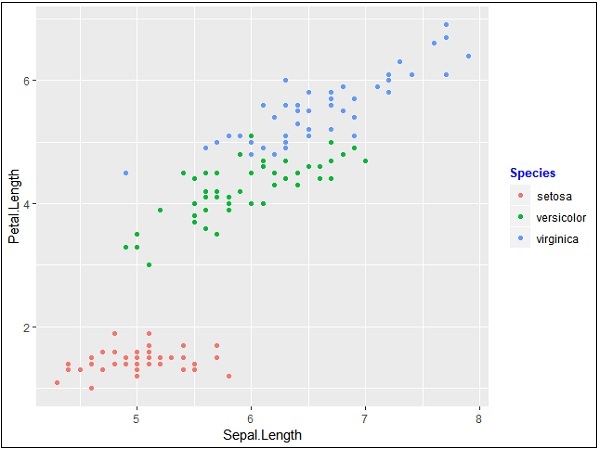
> # Load ggplot
> library(ggplot2)
>
> # Read in dataset
> data(iris)
>
> # Plot
> p <- ggplot(iris, aes(Sepal.Length, Petal.Length, colour=Species)) + geom_point()
> p
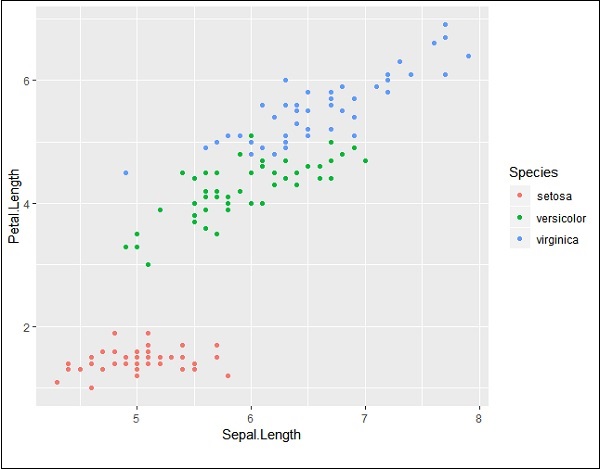
如果您觀察該圖,圖例將在最左側角建立,如下所示:
這裡,圖例包含給定資料集中各種型別的物種。
更改圖例的屬性
我們可以使用“legend.position”屬性刪除圖例,並獲得相應的輸出:
> # Remove Legend
> p + theme(legend.position="none")

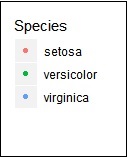
我們還可以使用“element_blank()”屬性隱藏圖例的標題,如下所示:
> # Hide the legend title
> p + theme(legend.title=element_blank())

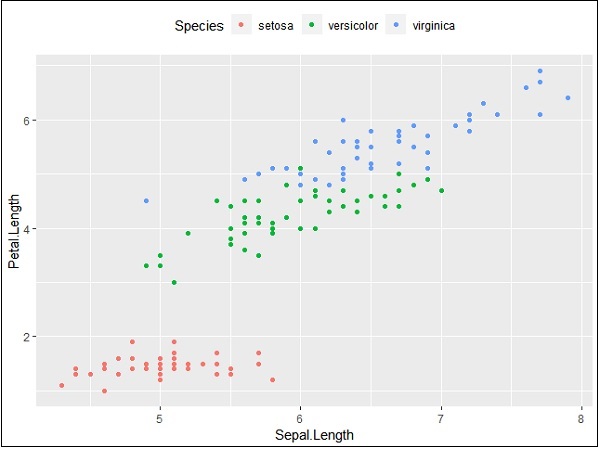
我們也可以根據需要使用圖例位置。此屬性用於生成準確的繪圖表示。
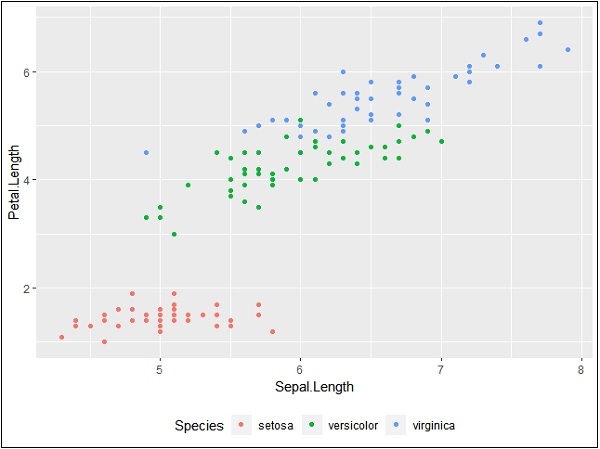
> #Change the legend position
> p + theme(legend.position="top")
>
> p + theme(legend.position="bottom")
頂部表示
底部表示
更改圖例的字型樣式
我們可以更改標題和其他圖例屬性的字型樣式和字型型別,如下所示:
> #Change the legend title and text font styles
> # legend title
> p + theme(legend.title = element_text(colour = "blue", size = 10, + face = "bold"))
> # legend labels
> p + theme(legend.text = element_text(colour = "red", size = 8, + face = "bold"))
生成的輸出如下所示:

後續章節將重點介紹各種型別的繪圖以及各種背景屬性(如顏色、主題)以及它們在資料科學角度的重要性。
廣告