
 資料結構
資料結構 網路
網路 RDBMS
RDBMS 作業系統
作業系統 Java
Java iOS
iOS HTML
HTML CSS
CSS Android
 Python
 C 程式設計
 C++
C++ C#
C# MongoDB
 MySQL
MySQL Javascript
 PHP
PHPPython 散點圖,每個 X 具有多個 Y 值
要為每個 X 繪製具有多個 Y 值的散點圖,我們可以使用 numpy 建立 x 和 y 資料點,將它們組合並迭代以建立散點圖。
步驟
設定圖形大小並調整子圖之間和周圍的填充。
使用 numpy 建立隨機 xs 和 ys 資料點。
對 xs 和 ys 進行組合。迭代這些組合。
繪製每個 x 和 y 值的散點圖。
使用 show() 方法顯示圖形。
示例
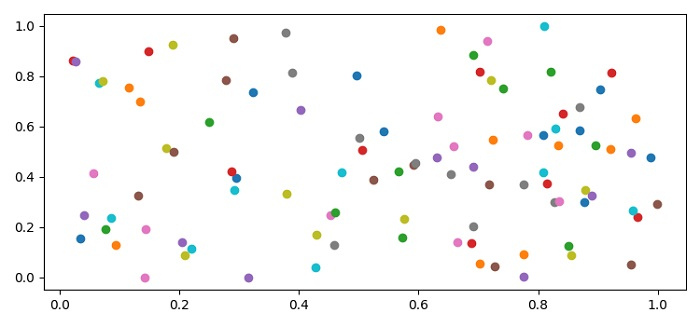
import numpy as np
from matplotlib import pyplot as plt
plt.rcParams["figure.figsize"] = [7.50, 3.50]
plt.rcParams["figure.autolayout"] = True
xs = np.random.rand(100)
ys = np.random.rand(100)
for x, y in zip(xs, ys):
   plt.scatter(x, y, cmap="copper")
plt.show()
輸出

更新時間:01-Jun-2021
8K+ 閱讀量

廣告