
 資料結構
資料結構 網路
網路 RDBMS
RDBMS 作業系統
作業系統 Java
Java iOS
iOS HTML
HTML CSS
CSS Android
 Python
 C 程式設計
 C++
C++ C#
C# MongoDB
 MySQL
MySQL Javascript
 PHP
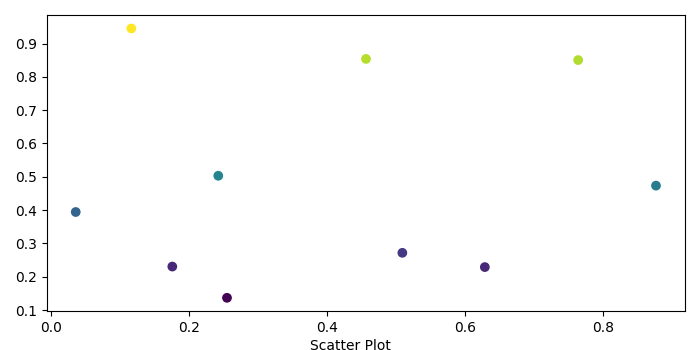
PHP使用 Matplotlib 為散點圖新增 X 軸下方的標題
要為散點圖新增 X 軸下方的標題,我們可以對當前圖形使用 text() 方法。
步驟
使用 numpy 建立 x 和 y 資料點。
使用 figure() 方法建立一個新圖形或啟用現有圖形。
使用 x 和 y 資料點繪製散點。
要向圖形新增標題,請使用 text() 方法。
調整子圖之間和周圍的內邊距。
要顯示圖形,請使用 show() 方法。
例項
import numpy as np
from matplotlib import pyplot as plt
plt.rcParams["figure.figsize"] = [7.00, 3.50]
plt.rcParams["figure.autolayout"] = True
x = np.random.rand(10)
y = np.random.rand(10)
fig = plt.figure()
plt.scatter(x, y, c=y)
fig.text(.5, .0001, "Scatter Plot", ha='center')
plt.tight_layout()
plt.show()
輸出

更新於: 2021 年 5 月 6 日
4K+ 檢視

廣告