
 資料結構
資料結構 網路
網路 RDBMS
RDBMS 作業系統
作業系統 Java
Java iOS
iOS HTML
HTML CSS
CSS Android
 Python
 C 語言程式設計
 C++
C++ C#
C# MongoDB
 MySQL
MySQL Javascript
 PHP
PHP在 Python 的 Matplotlib 中繪製球面上的點
要在 Python 中繪製球面上的點,我們可以使用 plot_surface() 方法。
步驟
使用 figure() 方法建立新圖形或啟用現有圖形。
使用 add_subplot() 方法新增一組子圖和 3D 投影。
初始化一個變數,r。
使用 numpy 獲取球面點和 x、y 和 z 資料點的 theta 值。
使用 plot_surface() 方法繪製曲面。
要顯示圖形,請使用 show() 方法。
示例
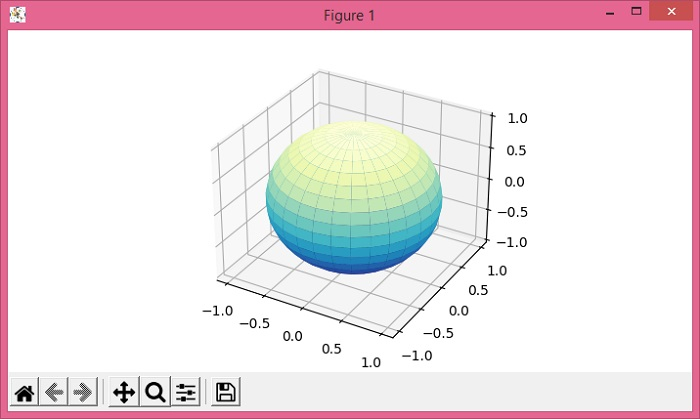
import matplotlib.pyplot as plt
import numpy as np
plt.rcParams["figure.figsize"] = [7.00, 3.50]
plt.rcParams["figure.autolayout"] = True
fig = plt.figure()
ax = fig.add_subplot(projection='3d')
r = 0.05
u, v = np.mgrid[0:2 * np.pi:30j, 0:np.pi:20j]
x = np.cos(u) * np.sin(v)
y = np.sin(u) * np.sin(v)
z = np.cos(v)
ax.plot_surface(x, y, z, cmap=plt.cm.YlGnBu_r)
plt.show()
輸出

更新於: 2021 年 5 月 15 日
13K+ 瀏覽

廣告