
 資料結構
資料結構 網路
網路 RDBMS
RDBMS 作業系統
作業系統 Java
Java iOS
iOS HTML
HTML CSS
CSS Android
 Python
 C 程式設計
 C++
C++ C#
C# MongoDB
 MySQL
MySQL Javascript
 PHP
PHP在 Matplotlib 中僅繪製熱圖的上/下三角
要在 matplotlib 中僅繪製熱圖的上/下三角,我們可以使用 numpy 來獲取掩碼的 2D 陣列,並將它們轉換為影像以生成熱圖。
步驟
設定圖形大小並調整子圖之間和周圍的填充。
建立 5×5 維度的隨機資料。
使用 numpy.tri() 方法建立陣列,其 1 值位於給定對角線及以下位置,在其他位置為 0。
獲取有掩碼的 2D 陣列資料(使用步驟 3)。
使用 imshow() 方法將資料顯示為影像,即顯示在 2D 常規光柵上。
要顯示圖形,請使用 show() 方法。
示例
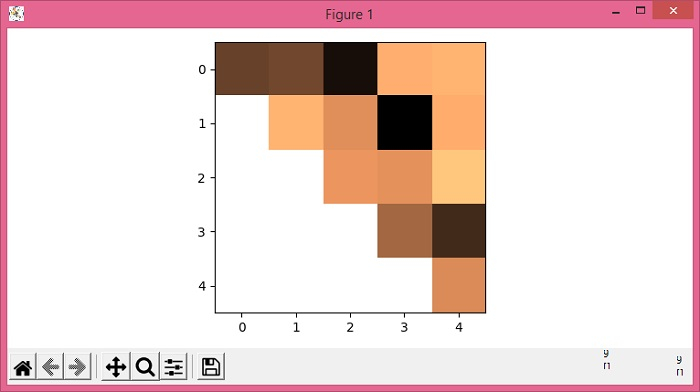
import numpy as np
from matplotlib import pyplot as plt
plt.rcParams["figure.figsize"] = [7.50, 3.50]
plt.rcParams["figure.autolayout"] = True
data = np.random.rand(5, 5)
mask = np.tri(data.shape[0], k=-1)
data = np.ma.array(data, mask=mask)
plt.imshow(data, interpolation="nearest", cmap='copper')
plt.show()
輸出

更新於: 01-Jun-2021
超過 1 千次瀏覽

廣告