
 資料結構
資料結構 網路
網路 關係型資料庫管理系統
 作業系統
作業系統 Java
Java iOS
iOS HTML
HTML CSS
CSS Android
 Python
 C 語言程式設計
 C++
C++ C#
C# MongoDB
 MySQL
MySQL Javascript
 PHP
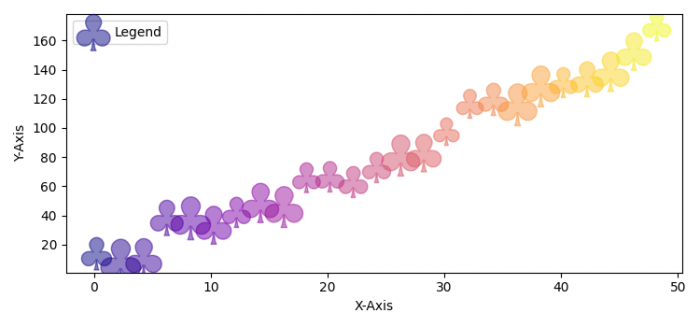
PHP在 Matplotlib 中繪製帶有四葉草符號的散點圖
若要在 Matplotlib 中繪製帶有四葉草符號的散點圖,我們可以執行以下步驟:
- 設定圖形尺寸並調整子圖之間和周圍的填充。
- 使用 numpy 建立x、y和z資料點。
- 使用scatter()方法繪製x、y和s。
- 設定 X 和 Y 軸標籤。
- 在繪製的左上角放置圖例。
- 使用show()方法顯示圖形。
示例
import matplotlib.pyplot as plt
import numpy as np

plt.rcParams["figure.figsize"] = [7.50, 3.50]
plt.rcParams["figure.autolayout"] = True

x = np.arange(0.0, 50.0, 2.0)
y = x ** 1.3 + np.random.rand(*x.shape) * 30.0
s = np.random.rand(*x.shape) * 800 + 500

plt.scatter(x, y, s, c=x, alpha=0.5, marker=r'$\clubsuit$',
            label="Legend", cmap="plasma")

plt.xlabel("X-Axis")
plt.ylabel("Y-Axis")

plt.legend(loc='upper left')

plt.show()
輸出

更新日期: 2021 年 6 月 16 日
235 次瀏覽

廣告