
 資料結構
資料結構 網路
網路 關係型資料庫管理系統 (RDBMS)
 作業系統
作業系統 Java
Java iOS
iOS HTML
HTML CSS
CSS Android
 Python
 C 程式設計
 C++
C++ C#
C# MongoDB
 MySQL
MySQL Javascript
 PHP
PHP使用 Python 的 Matplotlib 在 X 軸上繪製日期
使用 Pandas,我們可以 建立一個數據框 併為datetime設定索引。使用gcf().autofmt_xdate(),我們將調整 X 軸上的日期。
步驟
建立date_time列表,並使用pd.to_datetime()將其轉換為date_time。
假設 data = [1, 2, 3]
例項化DataFrame()物件,即DF。
使用步驟 2 中的資料設定DF['value']。
使用步驟 1 中的date_time設定DF.index()。
現在繪製資料框,即plt.plot(DF)。
獲取當前圖形並使其autofmt_xdate()。
使用plt.show()方法顯示圖形。
示例
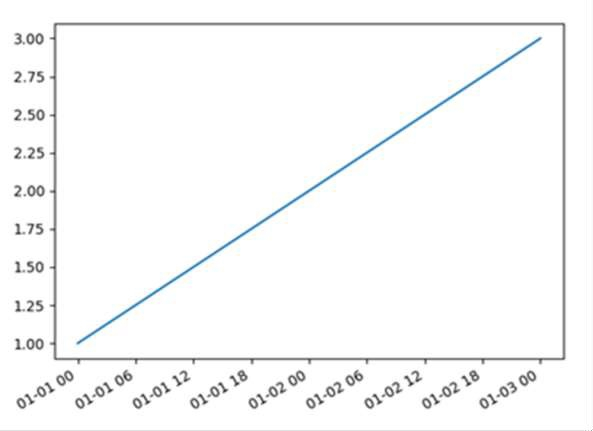
import pandas as pd
import matplotlib.pyplot as plt

date_time = ["2021-01-01", "2021-01-02", "2021-01-03"]
date_time = pd.to_datetime(date_time)
data = [1, 2, 3]

DF = pd.DataFrame()
DF['value'] = data
DF = DF.set_index(date_time)
plt.plot(DF)
plt.gcf().autofmt_xdate()
plt.show()
輸出

更新於: 2023年8月28日
32K+ 瀏覽量

廣告