
 資料結構
資料結構 網路
網路 關係型資料庫管理系統
 作業系統
作業系統 Java
Java iOS
iOS HTML
HTML CSS
CSS Android
 Python
 C 程式設計
 C++
C++ C#
C# MongoDB
 MySQL
MySQL Javascript
 PHP
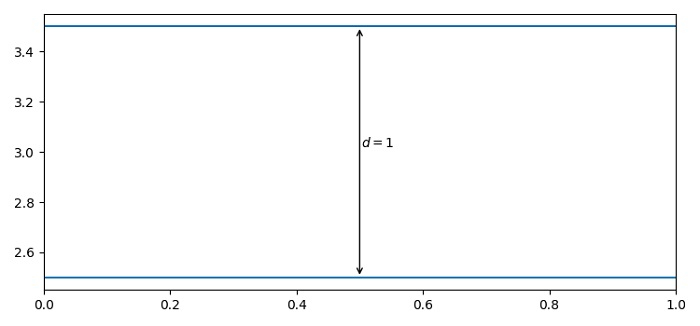
PHP使用 Matplotlib 在技術製圖中繪製距離箭頭
要在 matplotlib 中的技術製圖中繪製距離箭頭,我們可以使用帶有箭頭屬性的 annotate() 方法。
步驟
設定圖形的大小並調整子圖之間和周圍的邊距。
使用 axhline() 方法在軸上新增一條水平線,即 y=3.5。
使用 axhline() 方法在軸上新增一條水平線,即 y=2.5。
使用 annotate() 方法繪製一條箭頭線以顯示距離,並在下一條語句中再次使用 annotate() 方法顯示兩條水平線之間的距離。
要顯示圖形,請使用 show() 方法。
示例
from matplotlib import pyplot as plt
plt.rcParams["figure.figsize"] = [7.50, 3.50]
plt.rcParams["figure.autolayout"] = True
plt.axhline(3.5)
plt.axhline(2.5)
plt.annotate(
   '', xy=(0.5, 3.5), xycoords='data',
   xytext=(0.5, 2.5), textcoords='data',
   arrowprops={'arrowstyle': '<->'})
plt.annotate(
   '$\it{d=1}$', xy=(0.501, 3.0), xycoords='data',
   xytext=(0.5, 3.5), textcoords='offset points')
plt.show()
輸出

更新於:01-Jun-2021
837 次觀看

廣告