
 資料結構
資料結構 網路
網路 關係資料庫管理系統 (RDBMS)
 作業系統
作業系統 Java
Java iOS
iOS HTML
HTML CSS
CSS Android
 Python
 C 程式設計
 C++
C++ C#
C# MongoDB
 MySQL
MySQL Javascript
 PHP
PHP如何使用 Python 和 TensorFlow 來視覺化資料?
假設我們有一個花卉資料集。可以使用 Google API 下載該資料集,該 API 基本上鍊接到花卉資料集。“get_file”方法可以用來傳遞 API 作為引數。完成此操作後,資料將下載到環境中。
可以使用“matplotlib”庫對其進行視覺化。“imshow”方法用於在控制檯上顯示影像。
閱讀更多: 什麼是 TensorFlow,以及 Keras 如何與 TensorFlow 協同工作以建立神經網路?
我們將使用 Keras Sequential API,這有助於構建一個順序模型,用於處理簡單的層堆疊,其中每一層只有一個輸入張量和一個輸出張量。
使用 keras.Sequential 模型建立一個影像分類器,並使用 preprocessing.image_dataset_from_directory 載入資料。資料有效地從磁碟載入。識別過擬合併應用技術來減輕它。這些技術包括資料增強和 dropout。共有 3700 張花卉圖片。此資料集包含 5 個子目錄,每個類別一個子目錄:
- 雛菊(daisy),
- 蒲公英(dandelion),
- 玫瑰(roses),
- 向日葵(sunflowers)和
- 鬱金香(tulips)。
我們使用 Google Colaboratory 來執行以下程式碼。Google Colab 或 Colaboratory 幫助在瀏覽器上執行 Python 程式碼,無需任何配置,並可免費訪問 GPU(圖形處理單元)。Colaboratory 建立在 Jupyter Notebook 之上。
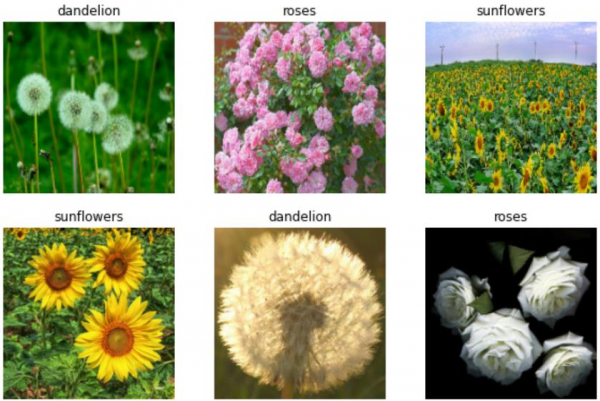
print("Visualizing the dataset")
import matplotlib.pyplot as plt
plt.figure(figsize=(10, 10))
for images, labels in train_ds.take(1):
   for i in range(6):
      ax = plt.subplot(3, 3, i + 1)
      plt.imshow(images[i].numpy().astype("uint8"))
      plt.title(class_names[labels[i]])
      plt.axis("off")

for image_batch, labels_batch in train_ds:
   print(image_batch.shape)
   print(labels_batch.shape)
   break
程式碼來源: https://www.tensorflow.org/tutorials/images/classification
輸出
Visualizing the dataset
(32, 180, 180, 3)
(32,)
解釋
- 使用 fit 方法訓練資料後,還可以手動迭代資料集以檢索影像批次。
- 這些資料顯示在控制檯上。
- image_batch 是形狀為 (32, 180, 180, 3) 的張量。
- 這是一個包含 32 個形狀為 180x180x3 的影像的批次。
- label_batch 是形狀為 (32,) 的張量,這些是與 32 個影像對應的標籤。
- 可以對 image_batch 和 labels_batch 張量呼叫 .numpy() 以將其轉換為 numpy.ndarray。

更新於: 2021年2月20日
212 次瀏覽

廣告