
 資料結構
資料結構 網路
網路 關係資料庫管理系統 (RDBMS)
 作業系統
作業系統 Java
Java iOS
iOS HTML
HTML CSS
CSS Android
 Python
 C 程式設計
 C++
C++ C#
C# MongoDB
 MySQL
MySQL Javascript
 PHP
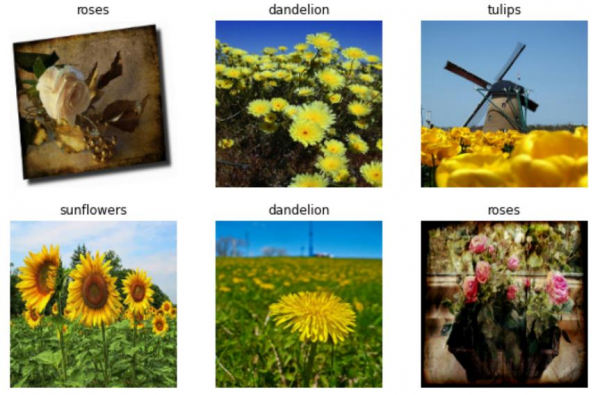
PHP如何使用 Python 和 TensorFlow 來視覺化花卉資料集?
可以使用 ‘matplotlib’ 庫來視覺化花卉資料集。 ‘imshow’ 方法用於在控制檯上顯示影像。整個資料集被迭代,並且只顯示前幾張影像。
閱讀更多: 什麼是 TensorFlow 以及 Keras 如何與 TensorFlow 協同工作以建立神經網路?
我們將使用花卉資料集,其中包含數千張花的影像。它包含 5 個子目錄,每個子目錄對應一個類別。
我們使用 Google Colaboratory 來執行以下程式碼。Google Colab 或 Colaboratory 幫助在瀏覽器上執行 Python 程式碼,無需任何配置,並可免費訪問 GPU(圖形處理單元)。Colaboratory 建立在 Jupyter Notebook 之上。
import matplotlib.pyplot as plt

print("Visualizing the flower dataset")
plt.figure(figsize=(10, 10))
for images, labels in train_ds.take(1):
   for i in range(6):
      ax = plt.subplot(3, 3, i + 1)
      plt.imshow(images[i].numpy().astype("uint8"))
      plt.title(class_names[labels[i]])
      plt.axis("off")

print("Iterating over dataset")
print("Retrieving batches of images")
for image_batch, labels_batch in train_ds:
   print(image_batch.shape)
   print(labels_batch.shape)
   break
程式碼來源:https://www.tensorflow.org/tutorials/load_data/images
輸出
Visualizing the flower dataset
Iterating over dataset
Retrieving batches of images
(32, 180, 180, 3)
(32,)
解釋
- 使用 matplotlib 庫視覺化花卉資料集。
- 迭代並顯示前 6 張影像。
- 再次迭代資料集,並在控制檯上顯示影像的尺寸。

更新於:2021年2月19日
198 次瀏覽

廣告