
 資料結構
資料結構 網路
網路 關係資料庫管理系統
 作業系統
作業系統 Java
Java iOS
iOS HTML
HTML CSS
CSS Android
 Python
 C 程式設計
 C++
C++ C#
C# MongoDB
 MySQL
MySQL Javascript
 PHP
PHP如何在 Python 中使用 matplotlib 在單個圖表上繪製 3 個不同的資料集?
Matplotlib 是一個流行的 Python 包,用於資料視覺化。視覺化資料是一個關鍵步驟,因為它有助於理解資料中正在發生的事情,而無需實際檢視數字並執行復雜的計算。它有助於有效地將定量見解傳達給受眾。
Matplotlib 用於使用資料建立二維圖。它帶有一個面向物件的 API,有助於將繪圖嵌入 Python 應用程式中。Matplotlib 可與 IPython shell、Jupyter notebook、Spyder IDE 等一起使用。它用 Python 編寫。它是使用 Numpy 建立的,Numpy 是 Python 中的數值 Python 包。
Python 可以使用以下命令在 Windows 上安裝:
pip install matplotlib
Matplotlib 的依賴項為:
Python ( greater than or equal to version 3.4)
NumPy
Setuptools
Pyparsing
Libpng
Pytz
Free type
Six
Cycler
Dateutil
讓我們瞭解如何使用 Matplotlib 在單個繪圖中繪製 3 個不同的資料集:
示例
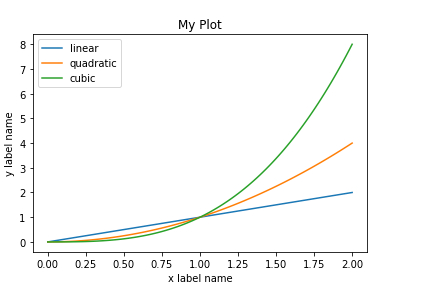
import matplotlib.pyplot as plt
import numpy as np
fig = plt.figure()
x = np.linspace(0, 2, 100)
fig, ax = plt.subplots()
ax.plot(x, x, label='linear')
ax.plot(x, x**2, label='quadratic')
ax.plot(x, x**3, label='cubic')
ax.set_xlabel('x label name')
ax.set_ylabel('y label name')
ax.set_title("My Plot")
ax.legend()
輸出
解釋
匯入所需的包併為其定義別名以方便使用。
使用“figure”函式建立一個空圖形。
使用 NumPy 包建立資料。
“subplot”函式用於為三個不同的繪圖建立輪廓。
定義三個資料集中的每個資料集的繪圖型別。
定義“X”和“Y”軸的標籤。
定義繪圖的標題,並在控制檯上顯示。

更新於: 2021年1月18日
5K+ 次檢視

廣告