
 資料結構
資料結構 網路
網路 關係資料庫管理系統
 作業系統
作業系統 Java
Java iOS
iOS HTML
HTML CSS
CSS Android
 Python
 C 程式語言
 C++
C++ C#
C# MongoDB
 MySQL
MySQL Javascript
 PHP
PHP如何在 Matplotlib Python 中繪製單個點?
若要在 matplotlib 中繪製單個數據點,可執行以下步驟 -
使用單個值初始化 x 和 y 的列表。
限制 X 和 Y 軸範圍為 0 到 5。
在當前行樣式中佈局網格。
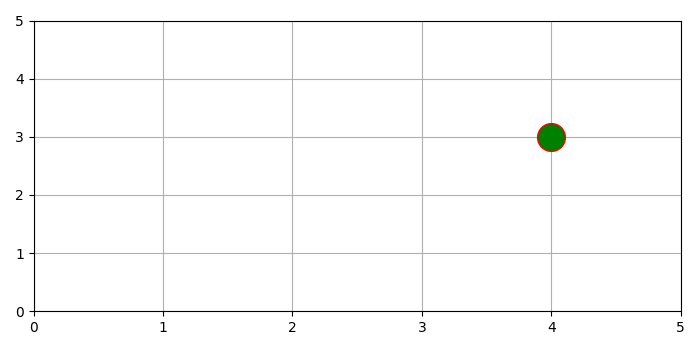
使用 plot() 方法繪製 x 和 y,並使用 marker="o", markeredgecolor="red", markerfacecolor="green"。
要顯示圖形,請使用 show() 方法。
示例
from matplotlib import pyplot as plt
plt.rcParams["figure.figsize"] = [7.00, 3.50]
plt.rcParams["figure.autolayout"] = True
x = [4]
y = [3]
plt.xlim(0, 5)
plt.ylim(0, 5)
plt.grid()
plt.plot(x, y, marker="o", markersize=20, markeredgecolor="red", markerfacecolor="green")
plt.show()
輸出

更新於: 23-Aug-2023
65K+ 瀏覽量

廣告