
 資料結構
資料結構 網路
網路 RDBMS
RDBMS 作業系統
作業系統 Java
Java iOS
iOS HTML
HTML CSS
CSS Android
 Python
 C 程式設計
 C++
C++ C#
C# MongoDB
 MySQL
MySQL Javascript
 PHP
PHP我如何能夠將 Matplotlib 繪圖作為 SVG 輸出?
只需使用 pyplot 包的 savefig 方法並提及檔案格式,我們就可以將輸出儲存為 SVG 格式。
步驟
使用子圖方法建立 fig 和 ax 變數,其中預設的 nrows 和 ncols 為 1。
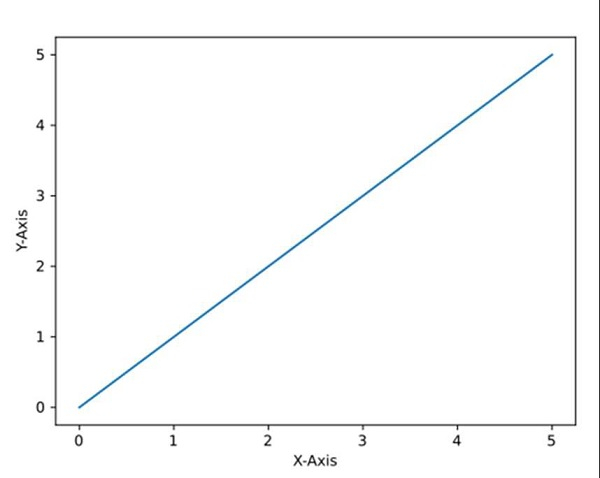
使用 np.array(0, 5) 建立 xpoints 和 ypoints。
使用 xpoints 和 ypoints 繪製線。
使用 plt.xlabel() 方法設定 X 軸標籤。
使用 plt.ylabel() 方法設定 Y 軸標籤。
要將檔案儲存為 SVG 格式,請使用 savefig() 方法,其中影像名稱為 myImagePDF.svg,格式為“svg”。
要顯示影像,請使用 plt.show() 方法。
示例
import matplotlib.pyplot as plt
import numpy as np

fig, ax = plt.subplots()
xpoints = np.array([0, 5])
ypoints = np.array([0, 5])
plt.plot(xpoints, ypoints)

plt.ylabel("Y-axis ")
plt.xlabel("X-axis ")

image_format = 'svg' # e.g .png, .svg, etc.
image_name = 'myimage.svg'

fig.savefig(image_name, format=image_format, dpi=1200)
輸出

更新時間:2021-03-17
15K+ 瀏覽

廣告