
 Data Structure
 Networking
 RDBMS
RDBMS Operating System
 Java
Java iOS
iOS HTML
HTML CSS
CSS Android
 Python
 C Programming
 C++
C++ C#
C# MongoDB
 MySQL
MySQL Javascript
 PHP
PHP如何在 matplotlib 中繪製直方圖,使其條形高度之和為 1?
在 plt.hist() 中,stacked=True 有助於使條形高度之和為 1。
步驟
建立數字列表。
使用 plt.hist(),我們可以繪製直方圖。
stacked : 布林值,預設為 False
如果為 "True",則將多個數據堆疊在彼此之上,如果 histtype 為 'bar',則如果 ``False`` 多個數據並排排列,如果 histtype 為 'step',則彼此之上。
density : 布林值,預設為 False
如果為 "True",則繪製並返回機率密度:每個垃圾箱將顯示垃圾箱的原始計數除以計數總數 *和垃圾箱寬度*。
要顯示圖形,請使用 plt.show() 方法。
示例
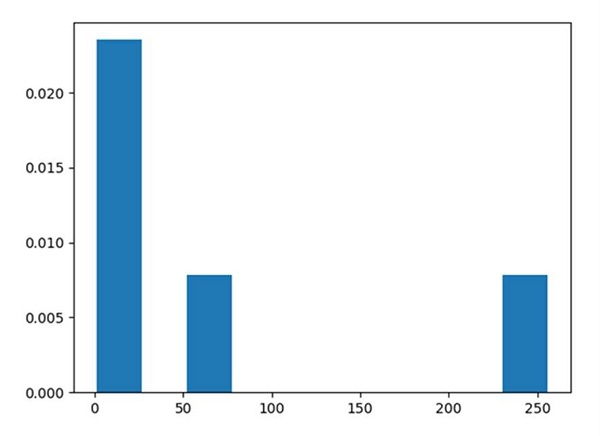
from matplotlib import pyplot as plt

x = [1, 4, 16, 64, 256]

# stacked and density are true then the sum of the histograms is normalized to 1.
plt.hist(x, 10, stacked=True, density=True)
plt.show()
輸出

更新於: 16-03-2021
477 次瀏覽

廣告