
 資料結構
資料結構 網路
網路 資料庫管理系統
 作業系統
作業系統 Java
Java iOS
iOS HTML
HTML CSS
CSS Android
 Python
 C 程式設計
 C++
C++ C#
C# MongoDB
 MySQL
MySQL JavaScript
 PHP
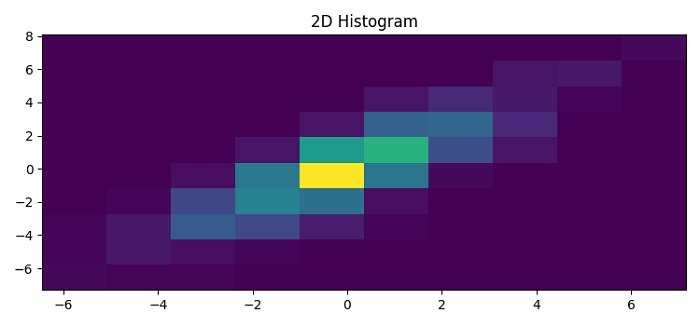
PHP如何在 Matplotlib 中繪製 2D 直方圖?
要在 matplotlib 中繪製 2D 直方圖,我們可以執行以下步驟:
設定圖形大小並調整子圖之間的填充及周圍的填充。
使用 numpy 建立 x 和 y 資料點。
建立圖形和一組子圖。
使用 hist2d() 方法繪製 x 和 y。
設定圖形標題。
要顯示圖形,使用 show() 方法。
示例
import numpy as np
from matplotlib import pyplot as plt

plt.rcParams["figure.figsize"] = [7.50, 3.50]
plt.rcParams["figure.autolayout"] = True

x = 2 * np.random.randn(5000)
y = x + np.random.randn(5000)

fig, ax = plt.subplots()
_ = ax.hist2d(x[::10], y[::10])

ax.set_title('2D Histogram')

plt.show()
輸出

更新於: 2021-06-03
3 千 + 瀏覽

廣告