
 資料結構
資料結構 網路
網路 RDBMS
RDBMS 作業系統
作業系統 Java
Java iOS
iOS HTML
HTML CSS
CSS Android
 Python
 C程式設計
C程式設計 C++
C++ C#
C# MongoDB
 MySQL
MySQL Javascript
 PHP
PHP如何在python中使用資料列表使用Matplotlib繪製直方圖?
要使用Matplotlib繪製直方圖,我們可以按照以下步驟操作 -
列出一些數字並將其分配給變數x。
使用plt.hist()方法繪製直方圖。
計算並繪製*x*的直方圖。
我們也可以在hist引數中傳入n維陣列。
要顯示繪製的圖形,可以使用plt.show()方法。
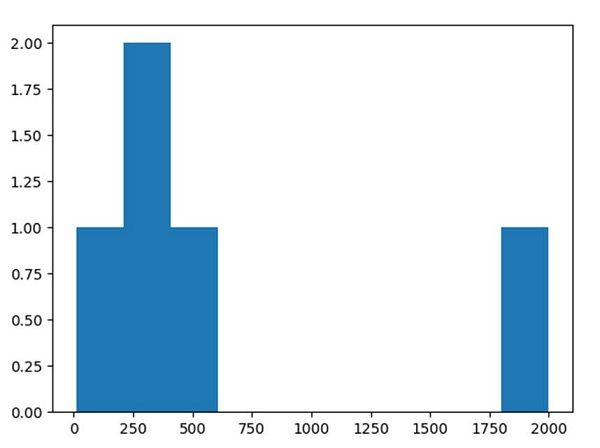
示例
from matplotlib import pyplot as plt

x = [300, 400, 500, 2000, 10]

plt.hist(x, 10)

plt.show()
輸出

更新於:15-Mar-2021
15K+瀏覽量

廣告