
 資料結構
資料結構 網路
網路 RDBMS
RDBMS 作業系統
作業系統 Java
Java iOS
iOS HTML
HTML CSS
CSS Android
 Python
 C 程式設計
 C++
C++ C#
C# MongoDB
 MySQL
MySQL Javascript
 PHP
PHP如何使用 Matplotlib 繪製二維數學向量?
以下步驟可供繪製二維數學向量:-
- 使用 numpy 陣列建立向量座標。
- 獲取 x、y、u 和 v 資料點。
- 使用 figure 方法建立新圖形或啟用現有圖形。
- 使用 gca() 方法獲取當前軸。
- 設定軸的 x 和 y 限制。
- 使用 draw() 方法重新繪製當前圖形。
- 使用 show() 方法顯示圖形。
示例
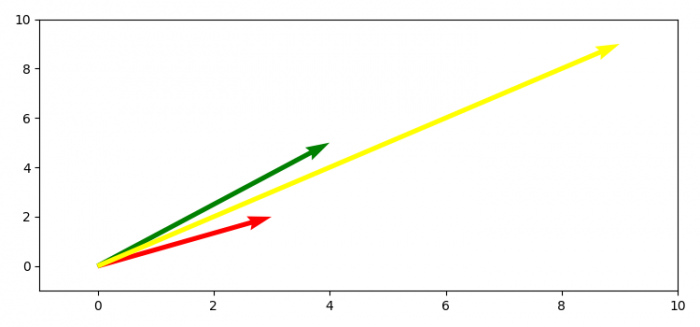
import numpy as np
import matplotlib.pyplot as plt
plt.rcParams["figure.figsize"] = [7.50, 3.50]
plt.rcParams["figure.autolayout"] = True
soa = np.array([[0, 0, 3, 2], [0, 0, 4, 5], [0, 0, 9, 9]])
X, Y, U, V = zip(*soa)
plt.figure()
ax = plt.gca()
ax.quiver(X, Y, U, V, angles='xy', scale_units='xy', scale=1, color=['red', 'green', 'yellow'])
ax.set_xlim([-1, 10])
ax.set_ylim([-1, 10])
plt.draw()
plt.show()
輸出

更新於: 06-May-2021
3K+ 瀏覽

廣告