
 資料結構
資料結構 網路
網路 RDBMS
RDBMS 作業系統
作業系統 Java
Java iOS
iOS HTML
HTML CSS
CSS Android
 Python
 C 程式語言
 C++
C++ C#
C# MongoDB
 MySQL
MySQL Javascript
 PHP
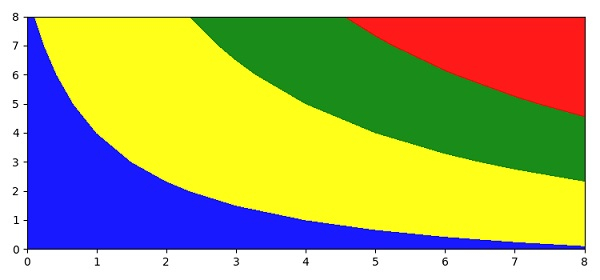
PHP如何繪製 matplotlib 等高線?
要繪製 matplotlib 等高線,我們可以按以下步驟操作 -
使用 numpy 為 x、y 和 h 建立資料點。
使用 countourf() 方法建立著色的 3D(類似)繪圖。
使用 set_over() 方法,當 "norm.clip = False" 時設定超出範圍的高值的顏色。
使用 set_under() 方法,當 "norm.clip = False" 時設定超出範圍的低值的顏色。
使用 changed() 方法,只要可繪製的地圖發生變化,就呼叫此方法將 "changed" 訊號通知所有回撥偵聽器。
使用 show() 方法顯示圖形。
示例
import numpy as np
from matplotlib import pyplot as plt
plt.rcParams["figure.figsize"] = [7.50, 3.50]
plt.rcParams["figure.autolayout"] = True
x = np.arange(1, 10)
y = x.reshape(-1, 1)
h = x * y
cs = plt.contourf(h, levels=[10, 30, 50], colors=['yellow', 'green', 'purple'], extend='both', alpha=.90)
cs.cmap.set_over('red')
cs.cmap.set_under('blue')
cs.changed()
plt.show()
輸出

更新於:2021 年 4 月 10 日
298 次瀏覽

廣告