
 資料結構
資料結構 網路
網路 RDBMS
RDBMS 作業系統
作業系統 Java
Java iOS
iOS HTML
HTML CSS
CSS Android
 Python
 C 程式設計
 C++
C++ C#
C# MongoDB
 MySQL
MySQL JavaScript
 PHP
PHP如何使用 Matplotlib 在 Python 中繪製向量?
使用 matplotlib 在 Python 中繪製向量,我們可以執行以下步驟:
建立 2×3 維度的矩陣。
建立原點,作為向量的起點。
使用**quiver() **方法繪製 3D 箭頭欄位,其中包括 **origin、data、colors**和 **scale=15**。
示例
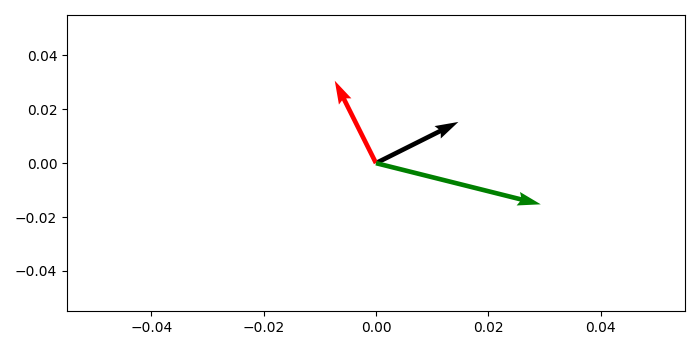
import numpy as np
from matplotlib import pyplot as plt
plt.rcParams["figure.figsize"] = [7.00, 3.50]
plt.rcParams["figure.autolayout"] = True
data = np.array([[2, 1], [-1, 2], [4, -1]])
origin = np.array([[0, 0, 0], [0, 0, 0]])
plt.quiver(*origin, data[:, 0], data[:, 1], color=['black', 'red', 'green'], scale=15)
plt.show()
輸出

更新於:08-May-2021
7K+ 瀏覽量

廣告