
 資料結構
資料結構 網路
網路 RDBMS
RDBMS 作業系統
作業系統 Java
Java iOS
iOS HTML
HTML CSS
CSS Android
 Python
 C 程式設計
 C++
C++ C#
C# MongoDB
 MySQL
MySQL Javascript
 PHP
PHP如何在 Python matplotlib 直方圖中為不同的條形指定不同的顏色?
如需在 matplotlib 直方圖中針對不同的條形指定不同的顏色,可執行以下步驟 −
步驟
設定影像大小並調整子圖之間的內邊距和子圖周圍的內邊距。
建立影像和一組子圖。
用隨機資料繪製直方圖,且樣本資料為 100。
在一定範圍內的柱狀圖集進行迭代,為每條柱狀圖設定隨機的填充顏色。
使用 **show()** 方法顯示圖片。
例項
import numpy as np
import matplotlib.pyplot as plt
import random
import string
# Set the figure size
plt.rcParams["figure.figsize"] = [7.50, 3.50]
plt.rcParams["figure.autolayout"] = True
# Figure and set of subplots
fig, ax = plt.subplots()
# Random data
data = np.random.rand(100)
# Plot a histogram with random data
N, bins, patches = ax.hist(data, edgecolor='black', linewidth=1)
# Random facecolor for each bar
for i in range(len(N)):
patches[i].set_facecolor("#" + ''.join(random.choices("ABCDEF" + string.digits, k=6)))
# Display the plot
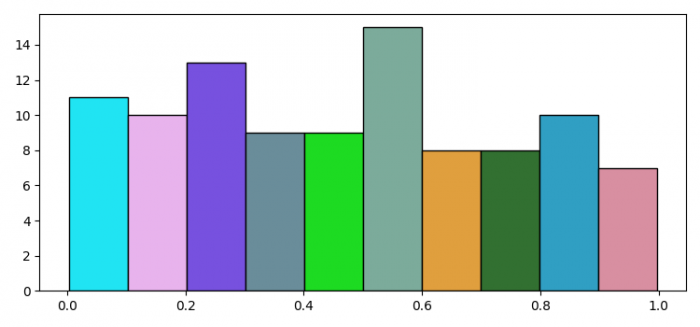
plt.show()輸出
將產生以下輸出 −

更新於: 2022-02-01
5K+ 瀏覽量

廣告