
 資料結構
資料結構 網路
網路 關係型資料庫管理系統
 作業系統
作業系統 Java
Java iOS
iOS HTML
HTML CSS
CSS Android
 Python
 C 程式設計
 C++
C++ C#
C# MongoDB
 MySQL
MySQL Javascript
 PHP
PHP如何在 Python 中使用 Bokeh 庫視覺化雙軸?
Bokeh 是一個用於資料視覺化的 Python 包。它是一個開源專案。Bokeh 使用 HTML 和 JavaScript 渲染其繪圖。這表明它在處理基於 Web 的儀表板時很有用。
Matplotlib 和 Seaborn 生成靜態繪圖,而 Bokeh 生成互動式繪圖。這意味著當用戶與這些繪圖互動時,它們會相應地改變。
繪圖可以嵌入為 Flask 或 Django 啟用的 Web 應用程式的輸出。Jupyter notebook 也可以用於渲染這些繪圖。
在 Windows 命令提示符下安裝 Bokeh
pip3 install bokeh
在 Anaconda 提示符下安裝 Bokeh
conda install bokeh
讓我們看一個例子 -
示例
From numpy import pi, arange, sin, linspace
x = arange(−2.5*pi, 2.5*pi, 0.15)
y = sin(x)
y2 = linspace(0, 176, len(y))
from bokeh.plotting import output_file, figure, show
from bokeh.models import LinearAxis, Range1d
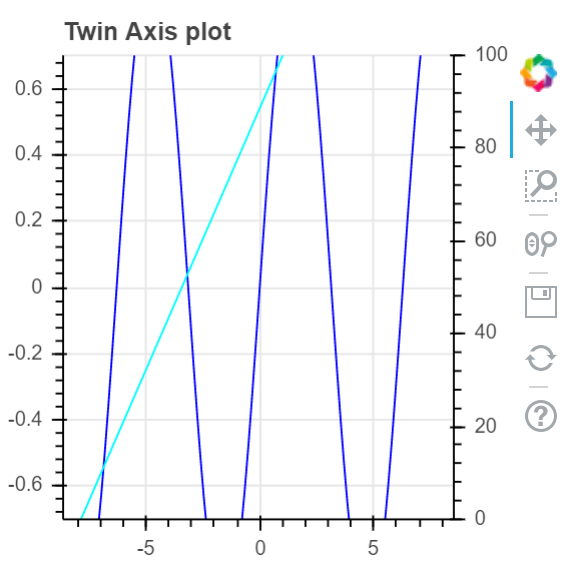
my_fig = figure(title='Twin Axis plot',plot_width = 300, plot_height = 300, y_range = (−0.7, 0.7))
my_fig.line(x, y, color = "blue")
my_fig.extra_y_ranges = {"y2": Range1d(start = 0, end = 100)}
my_fig.add_layout(LinearAxis(y_range_name = "y2"), 'right')
my_fig.line(x, y2, color = "cyan", y_range_name = "y2")
show(my_fig)輸出
解釋
匯入併為所需的包設定別名。
呼叫 figure 函式並設定繪圖寬度和高度。
使用 NumPy 生成資料。
呼叫 'output_file' 函式以指定將生成的 html 檔案的名稱。
呼叫 Bokeh 中的 'line' 函式,並傳入資料。
使用 'show' 函式顯示繪圖。

更新於: 2021年1月18日
209 次檢視

廣告