
 資料結構
資料結構 網路
網路 關係資料庫管理系統 (RDBMS)
 作業系統
作業系統 Java
Java iOS
iOS HTML
HTML CSS
CSS Android
 Python
 C 語言程式設計
 C++
C++ C#
C# MongoDB
 MySQL
MySQL Javascript
 PHP
PHP在 MATLAB 中自動繪製不同顏色的線條
在一個繪圖中使用不同顏色的線條可以讓我們在同一個繪圖區域上繪製和區分多個數據集。MATLAB 提供了各種內建函式來自動為不同的繪圖線條分配不同的顏色。為了自動控制繪圖線條的顏色,我們可以使用以下兩個 MATLAB 函式
使用“hold”選項自動繪製不同顏色的線條
在 MATLAB 程式設計中,我們可以使用“hold”選項來自動繪製不同顏色的線條。
語法
hold on;
以下 MATLAB 程式解釋瞭如何使用“hold”函式繪製不同顏色的線條。
示例
% MATLAB program to demonstrate automatically plot different color lines using “hold” option.
% Create a sample vector of data
x = 0:1:360;          % Angle in degrees
y = sind(x);          % sine values
z = cosd(x);          % cosine values
figure;
% Plot the data sets
plot(x, y, x, z);
% Make the current plot active by using “hold on” command
hold on;
plot (sind(x));
plot (cosd(x));
% Add a legend
legend("Location", "north");
輸出
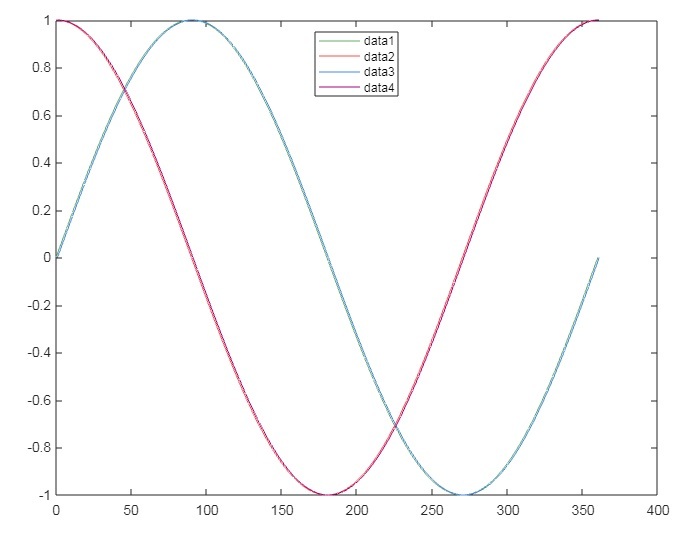
解釋
在這個 MATLAB 程式中,我們首先建立資料集“x”、“y”和“z”。然後,我們使用“plot”函式繪製圖形。接下來,我們使用“hold on”命令保持當前繪圖處於活動狀態並允許後續繪圖疊加,這確保了每個繪圖線條都將以不同的顏色繪製。最後,我們呼叫“legend”函式新增圖例,以提供有關不同顏色線條的資訊。
使用“rand”函式自動繪製不同顏色的線條
MATLAB 具有“rand”函式,可用於生成隨機顏色順序並將其設定為不同的繪圖線條。
語法
colors = rand (n, m);
colororder(colors);
此函式將建立一個 n x m 階的隨機 RGB 值矩陣,其值介於 0 和 1 之間。然後,此顏色值用作函式“colororder”中的引數,以定義我們不同繪圖線條的顏色。
以下 MATLAB 程式演示瞭如何使用 rand 函式自動繪製不同顏色的線條。
示例
% MATLAB program to demonstrate automatically plot different color lines using “rand” function.
% Create a random 5 x 3 matrix of RGB values ranging between 0 and 1.
colors = rand(5, 3);
% Set the color order for plots
colororder(colors);
% Create a sample data to plot
x = 0:1:360;
y1 = sind(x);
y2 = cosd(x);
% Plot x, y1, and y2 using the plot function
figure;
plot(x, y1, x, y2);
% Add a legend
legend;
輸出
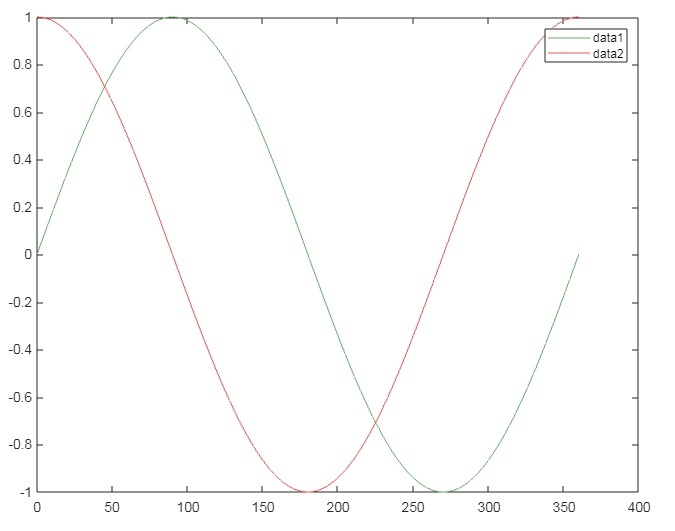
結論
在這個 MATLAB 程式中,我們首先使用“rand”函式建立一個介於 0 和 1 之間的 5 x 3 隨機 RGB 值矩陣,並將其儲存在變數“colors”中。在這個隨機 RGB 矩陣中,每一行指定了一種不同的顏色。然後,我們使用“colors”作為引數呼叫“colororder”函式來定義繪圖的顏色順序。
之後,我們編寫繪圖程式碼並呼叫“plot”函式繪製兩條來自上述建立的顏色順序的不同顏色的線條。最後,我們呼叫“legend”函式新增圖例。
這就是我們如何在 MATLAB 中自動繪製不同顏色線條的方法。

615 次瀏覽
