- LeafletJS 教程
- LeafletJS - 首頁
- LeafletJS - 入門
- LeafletJS - 標記
- LeafletJS - 向量圖層
- LeafletJS - 多線段和多邊形
- LeafletJS - 圖層組
- LeafletJS - 事件處理
- LeafletJS - 疊加層
- LeafletJS - 控制元件
- LeafletJS 有用資源
- LeafletJS - 快速指南
- LeafletJS - 有用資源
- LeafletJS - 討論
LeafletJS - 向量圖層
在上一章中,我們學習瞭如何在 Leaflet 中使用標記。除了標記外,我們還可以新增各種形狀,例如圓形、多邊形、矩形、折線等。在本章中,我們將討論如何使用 Google Maps 提供的形狀。
折線
要使用 Leaflet JavaScript 庫在地圖上繪製折線疊加層,請按照以下步驟操作:
步驟 1 − 透過傳遞 <div> 元素(字串或物件)和地圖選項(可選)來建立 Map 物件。
步驟 2 − 透過傳遞所需瓦片圖層的 URL 來建立 Layer 物件。
步驟 3 − 使用 Map 類的 addLayer() 方法將圖層物件新增到地圖。
步驟 4 − 建立一個 latlangs 變數來儲存繪製折線的點,如下所示。
// Creating latlng object
var latlngs = [
   [17.385044, 78.486671],
   [16.506174, 80.648015],
   [17.000538, 81.804034],
   [17.686816, 83.218482]
];
步驟 5 − 使用 L.polyline() 建立折線。要繪製折線,請將位置作為變數傳遞,並提供一個選項來指定線的顏色。
// Creating a poly line
var polyline = L.polyline(latlngs, {color: 'red'});
步驟 6 − 使用 Polyline 類的 addTo() 方法將折線新增到地圖。
// Adding to poly line to map
polyline.addTo(map);
示例
以下是繪製一條折線的程式碼,覆蓋海德拉巴、維傑瓦達、拉賈馬亨德拉瓦拉姆和維沙卡帕特南(印度)等城市。
DOCTYPE html>
<html>
   <head>
      <title>Leaflet Poly lines</title>
      <link rel = "stylesheet" href = "http://cdn.leafletjs.com/leaflet-0.7.3/leaflet.css"/>
      <script src = "http://cdn.leafletjs.com/leaflet-0.7.3/leaflet.js"></script>
   </head>

   <body>
      <div id = "map" style = "width:900px; height:580px"></div>
      <script>
         // Creating map options
         var mapOptions = {
            center: [16.506174, 80.648015],
            zoom: 7
         }
         // Creating a map object
         var map = new L.map('map', mapOptions);

         // Creating a Layer object
         var layer = new L.TileLayer('http://{s}.tile.openstreetmap.org/{z}/{x}/{y}.png');

         // Adding layer to the map
         map.addLayer(layer);

         // Creating latlng object
         var latlngs = [
            [17.385044, 78.486671],
            [16.506174, 80.648015],
            [17.000538, 81.804034],
            [17.686816, 83.218482]
         ];
         // Creating a poly line
         var polyline = L.polyline(latlngs, {color: 'red'});

         // Adding to poly line to map
         polyline.addTo(map);
      </script>
   </body>

</html>
它生成以下輸出

多邊形
要使用 Leaflet JavaScript 庫在地圖上繪製多邊形疊加層,請按照以下步驟操作:
步驟 1 − 透過傳遞 <div> 元素(字串或物件)和地圖選項(可選)來建立 Map 物件。
步驟 2 − 透過傳遞所需瓦片圖層的 URL 來建立 Layer 物件。
步驟 3 − 使用 Map 類的 addLayer() 方法將圖層物件新增到地圖。
步驟 4 − 建立一個 latlangs 變數來儲存繪製多邊形的點。
// Creating latlng object
var latlngs = [
   [17.385044, 78.486671],
   [16.506174, 80.648015],
   [17.686816, 83.218482]
];
步驟 5 − 使用 L.polygon() 建立多邊形。將位置/點作為變數傳遞以繪製多邊形,並提供一個選項來指定多邊形的顏色。
// Creating a polygon
var polygon = L.polygon(latlngs, {color: 'red'});
步驟 6 − 使用 Polygon 類的 addTo() 方法將多邊形新增到地圖。
// Adding to polygon to map
polygon.addTo(map);
示例
以下是繪製一個覆蓋海德拉巴、維傑瓦達和維沙卡帕特南(印度)等城市的程式碼。
<!DOCTYPE html>
<html>
   <head>
      <title>Leaflet Polygons</title>
      <link rel = "stylesheet" href = "http://cdn.leafletjs.com/leaflet-0.7.3/leaflet.css"/>
      <script src = "http://cdn.leafletjs.com/leaflet-0.7.3/leaflet.js"></script>
   </head>

   <body>
      <div id = "map" style = "width:900px; height:580px"></div>
      <script>
         // Creating map options
         var mapOptions = {
            center: [16.506174, 80.648015],
            zoom: 7
         }
         // Creating a map object
         var map = new L.map('map', mapOptions);

         // Creating a Layer object
         var layer = new L.TileLayer('http://{s}.tile.openstreetmap.org/{z}/{x}/{y}.png');

         // Adding layer to the map
         map.addLayer(layer);

         // Creating latlng object
         var latlngs = [
            [17.385044, 78.486671],
            [16.506174, 80.648015],
            [17.686816, 83.218482]
         ];
         // Creating a polygon
         var polygon = L.polygon(latlngs, {color: 'red'});

         // Adding to polygon to map
         polygon.addTo(map);
      </script>
   </body>

</html>
它生成以下輸出:

矩形
要使用 Leaflet JavaScript 庫在地圖上繪製矩形疊加層,請按照以下步驟操作
步驟 1 − 透過傳遞 <div> 元素(字串或物件)和地圖選項(可選)來建立 Map 物件。
步驟 2 − 透過傳遞所需瓦片圖層的 URL 來建立 Layer 物件。
步驟 3 − 使用 Map 類的 addLayer() 方法將圖層物件新增到地圖。
步驟 4 − 建立一個 latlangs 變數來儲存在地圖上繪製矩形的點。
// Creating latlng object
var latlngs = [
   [17.342761, 78.552432],
   [16.396553, 80.727725]
];
步驟 5 − 使用 L.rectangle() 函式建立矩形。將位置/點作為變數傳遞以繪製矩形,並將 rectangleOptions 用於指定矩形的顏色和粗細。
// Creating rectOptions
var rectOptions = {color: 'Red', weight: 1}

// Creating a rectangle
var rectangle = L.rectangle(latlngs, rectOptions);
步驟 6 − 使用 Polygon 類的 addTo() 方法將矩形新增到地圖。
// Adding to rectangle to map
rectangle.addTo(map);
示例
以下是使用 Leaflet JavaScript 庫在地圖上繪製矩形的程式碼。
<!DOCTYPE html>
<html>
   <head>
      <title>Leaflet Rectangle</title>
      <link rel = "stylesheet" href = "http://cdn.leafletjs.com/leaflet-0.7.3/leaflet.css"/>
      <script src = "http://cdn.leafletjs.com/leaflet-0.7.3/leaflet.js"></script>
   </head>

   <body>
      <div id = "map" style = "width:900px; height:580px"></div>
      <script>
         // Creating map options
         var mapOptions = {
            center: [16.506174, 80.648015],
            zoom: 7
         }
         var map = new L.map('map', mapOptions); // Creating a map object

         // Creating a Layer object
         var layer = new L.TileLayer('http://{s}.tile.openstreetmap.org/{z}/{x}/{y}.png');
         map.addLayer(layer); // Adding layer to the map

         // Creating latlng object
         var latlngs = [
            [17.342761, 78.552432],
            [16.396553, 80.727725]
         ];
         var rectOptions = {color: 'Red', weight: 1}   // Creating rectOptions

         // Creating a rectangle
         var rectangle = L.rectangle(latlngs, rectOptions);
         rectangle.addTo(map);   // Adding to rectangle to map
      </script>
   </body>

</html>
它生成以下輸出:

圓形
要使用 Leaflet JavaScript 庫在地圖上繪製圓形疊加層,請按照以下步驟操作。
步驟 1 − 透過傳遞 <div> 元素(字串或物件)和地圖選項(可選)來建立 Map 物件。
步驟 2 − 透過傳遞所需瓦片圖層的 URL 來建立 Layer 物件。
步驟 3 − 使用 Map 類的 addLayer() 方法將圖層物件新增到地圖。
步驟 4 − 建立一個 latlangs 變數來儲存圓心的座標,如下所示。
// Center of the circle
var circleCenter = [17.385044, 78.486671];
步驟 5 − 建立一個 circleOptions 變數,為顏色、填充顏色和填充不透明度等選項指定值,如下所示。
// Circle options
var circleOptions = {
   color: 'red',
   fillColor: '#f03',
   fillOpacity: 0
}
步驟 6 − 使用 L.circle() 建立圓形。將圓心、半徑和圓形選項傳遞給此函式。
// Creating a circle
var circle = L.circle(circleCenter, 50000, circleOptions);
步驟 7 − 使用 Polyline 類的 addTo() 方法將上面建立的圓形新增到地圖。
// Adding circle to the map
circle.addTo(map);
示例
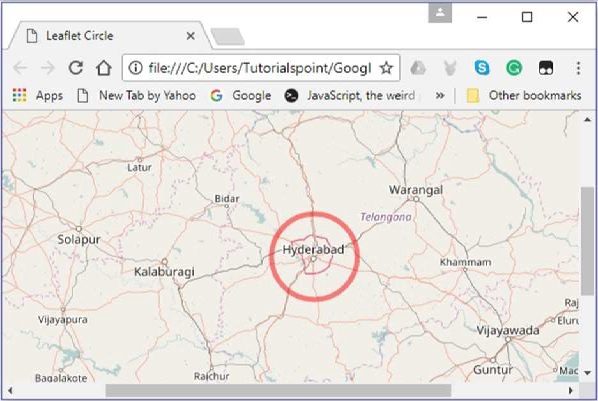
以下是繪製一個以海德拉巴市座標為中心的圓形的程式碼。
<!DOCTYPE html>
<html>
   <head>
      <title>Leaflet Circle</title>
      <link rel = "stylesheet" href = "http://cdn.leafletjs.com/leaflet-0.7.3/leaflet.css"/>
      <script src = "http://cdn.leafletjs.com/leaflet-0.7.3/leaflet.js"></script>
   </head>

   <body>
      <div id = "map" style = "width: 900px; height: 580px"></div>
      <script>
         // Creating map options
         var mapOptions = {
            center: [17.385044, 78.486671],
            zoom: 7
         }
         var map = new L.map('map', mapOptions); // Creating a map object

         // Creating a Layer object
         var layer = new L.TileLayer('http://{s}.tile.openstreetmap.org/{z}/{x}/{y}.png');
         map.addLayer(layer);        // Adding layer to the map
         var circleCenter = [17.385044, 78.486671];     // Center of the circle

         // Circle options
         var circleOptions = {
            color: 'red',
            fillColor: '#f03',
            fillOpacity: 0
         }
         // Creating a circle
         var circle = L.circle(circleCenter, 50000, circleOptions);
         circle.addTo(map);     // Adding circle to the map
      </script>
   </body>

</html>>
它生成以下輸出: