- LeafletJS 教程
- LeafletJS - 首頁
- LeafletJS - 開始
- LeafletJS - 標記
- LeafletJS - 向量圖層
- LeafletJS - 多線和多邊形
- LeafletJS - 圖層組
- LeafletJS - 事件處理
- LeafletJS - 疊加層
- LeafletJS - 控制元件
- LeafletJS 有用資源
- LeafletJS - 快速指南
- LeafletJS - 有用資源
- LeafletJS - 討論
LeafletJS - 控制元件
Leaflet 提供各種控制元件,例如縮放、署名、比例尺等,其中:
縮放 − 預設情況下,此控制元件位於地圖的左上角。它有兩個按鈕"+"和"–",您可以使用它們放大或縮小地圖。您可以透過將地圖選項的zoomControl選項設定為false來移除預設的縮放控制元件。
署名 − 預設情況下,此控制元件位於地圖的右下角。它在一個小的文字框中顯示署名資料。預設情況下,它顯示文字。您可以透過將地圖選項的attributionControl選項設定為false來移除預設的署名控制元件。
比例尺 − 預設情況下,此控制元件位於地圖的左下角。它顯示螢幕當前的中心點。
本章將解釋如何使用 Leaflet JavaScript 庫建立並將所有這三個控制元件新增到您的地圖中。
縮放
要使用 Leaflet JavaScript 庫向地圖新增您自己的縮放控制元件,請按照以下步驟操作:
步驟 1 − 透過傳遞一個元素(字串或物件)和地圖選項(可選)來建立一個地圖物件。
步驟 2 − 透過傳遞所需瓦片的 URL 來建立一個圖層物件。
步驟 3 − 使用Map類的addLayer()方法將圖層物件新增到地圖。
步驟 4 − 建立 zoomOptions 變數,並定義您自己的放大和縮小選項文字值,而不是預設值(+ 和 -)。
然後,透過將 zoomOptions 變數傳遞給L.control.zoom()來建立縮放控制元件,如下所示。
// zoom control options
var zoomOptions = {
   zoomInText: '1',
   zoomOutText: '0',
};
// Creating zoom control
var zoom = L.control.zoom(zoomOptions);
步驟 5 − 使用addTo()方法將上一步中建立的縮放控制元件物件新增到地圖。
// Adding zoom control to the map
zoom.addTo(map);
示例
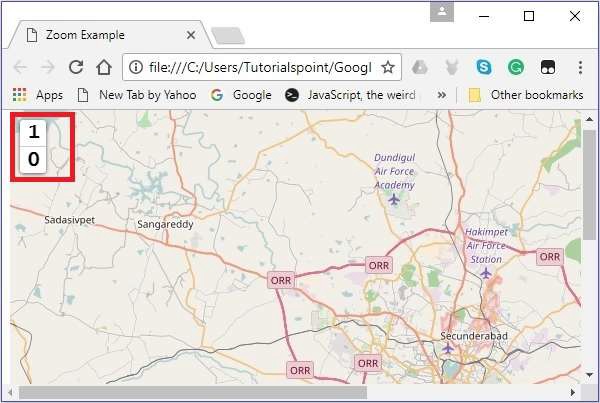
以下是將您自己的縮放控制元件新增到地圖(而不是預設控制元件)的程式碼。在這裡,按下 1 時地圖放大,按下 0 時地圖縮小。
<!DOCTYPE html>
<html>
   <head>
      <title>Zoom Example</title>
      <link rel = "stylesheet" href = "http://cdn.leafletjs.com/leaflet-0.7.3/leaflet.css"/>
      <script src = "http://cdn.leafletjs.com/leaflet-0.7.3/leaflet.js"></script>
   </head>

   <body>
      <div id = "map" style = "width:900px; height:580px"></div>
      <script>
         // Creating map options
         var mapOptions = {
            center: [17.385044, 78.486671],
            zoom: 10,
            zoomControl: false
         }
         var map = new L.map('map', mapOptions); // Creating a map object

         // Creating a Layer object
         var layer = new L.TileLayer('http://{s}.tile.openstreetmap.org/{z}/{x}/{y}.png');
         map.addLayer(layer);   // Adding layer to the map

         // zoom control options
         var zoomOptions = {
            zoomInText: '1',
            zoomOutText: '0',
         };
         var zoom = L.control.zoom(zoomOptions);   // Creating zoom control
         zoom.addTo(map);   // Adding zoom control to the map
      </script>
   </body>

</html>
它生成以下輸出:
署名
要使用 Leaflet JavaScript 庫向地圖新增您自己的署名,請按照以下步驟操作:
步驟 1 − 透過傳遞一個<div>元素(字串或物件)和地圖選項(可選)來建立一個地圖物件。
步驟 2 − 透過傳遞所需瓦片的 URL 來建立一個圖層物件。
步驟 3 − 使用Map類的addLayer()方法將圖層物件新增到地圖。
步驟 4 − 建立attrOptions變數,並定義您自己的字首值,而不是預設值 (leaflet)。
然後,透過將attrOptions變數傳遞給L.control.attribution()來建立署名控制元件,如下所示。
// Attribution options
var attrOptions = {
   prefix: 'attribution sample'
};

// Creating an attribution
var attr = L.control.attribution(attrOptions);
步驟 5 − 使用addTo()方法將上一步中建立的署名控制元件物件新增到地圖。
// Adding attribution to the map
attr.addTo(map);
示例
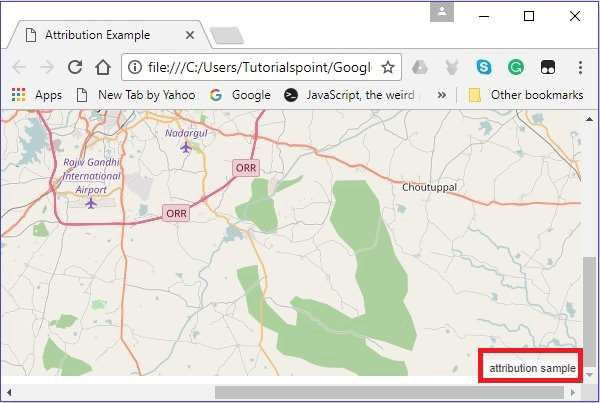
以下程式碼將我們自己的署名控制元件新增到您的地圖中,而不是預設控制元件。這裡將顯示文字attribution sample。
<!DOCTYPE html>
<html>
   <head>
      <title>Attribution Example</title>
      <link rel = "stylesheet" href = "http://cdn.leafletjs.com/leaflet-0.7.3/leaflet.css"/>
      <script src = "http://cdn.leafletjs.com/leaflet-0.7.3/leaflet.js"></script>
   </head>

   <body>
      <div id = "map" style = "width: 900px; height: 580px"></div>
      <script>
         // Creating map options
         var mapOptions = {
            center: [17.385044, 78.486671],
            zoom: 10,
            attributionControl: false
         }
         var map = new L.map('map', mapOptions); // Creating a map object

         // Creating a Layer object
         var layer = new L.TileLayer('http://{s}.tile.openstreetmap.org/{z}/{x}/{y}.png');
         map.addLayer(layer);    // Adding layer to the map

         // Attribution options
         var attrOptions = {
            prefix: 'attribution sample'
         };

         // Creating an attribution
         var attr = L.control.attribution(attrOptions);
         attr.addTo(map);  // Adding attribution to the map
      </script>
   </body>

</html>>
它生成以下輸出:
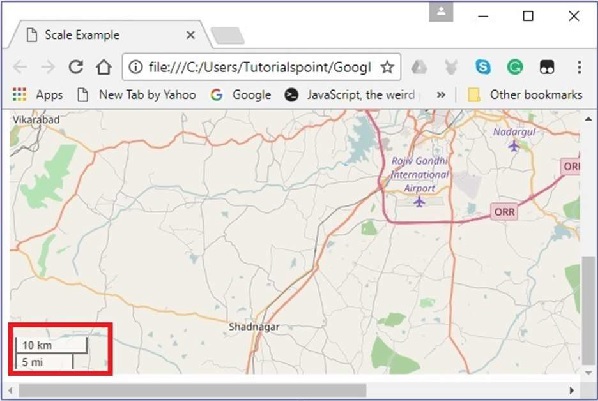
比例尺
要使用 Leaflet JavaScript 庫向地圖新增您自己的比例尺控制元件,請按照以下步驟操作:
步驟 1 − 透過傳遞一個<div>元素(字串或物件)和地圖選項(可選)來建立一個地圖物件。
步驟 2 − 透過傳遞所需瓦片的 URL 來建立一個圖層物件。
步驟 3 − 使用Map類的addLayer()方法將圖層物件新增到地圖。
步驟 4 − 透過使用L.control.scale()建立比例尺控制元件,如下所示。
// Creating scale control
var scale = L.control.scale();
步驟 5 − 使用addTo()方法將上一步中建立的比例尺控制元件物件新增到地圖,如下所示。
// Adding scale control to the map
scale.addTo(map);
示例
以下程式碼將比例尺控制元件新增到您的地圖。
<!DOCTYPE html>
<html>
   <head>
      <title>Scale Example</title>
      <link rel = "stylesheet" href = "http://cdn.leafletjs.com/leaflet-0.7.3/leaflet.css" />
      <script src = "http://cdn.leafletjs.com/leaflet-0.7.3/leaflet.js"></script>
   </head>

   <body>
      <div id = "map" style = "width:900px; height:580px"></div>
      <script>
         // Creating map options
         var mapOptions = {
            center: [17.385044, 78.486671],
            zoom: 10
         }
         // Creating a map object
         var map = new L.map('map', mapOptions);

         // Creating a Layer object
         var layer = new L.TileLayer('http://{s}.tile.openstreetmap.org/{z}/{x}/{y}.png');
         map.addLayer(layer); // Adding layer to the map
         var scale = L.control.scale(); // Creating scale control
         scale.addTo(map); // Adding scale control to the map
      </script>
   </body>

</html>
它生成以下輸出: