- LeafletJS 教程
- LeafletJS - 首頁
- LeafletJS - 快速入門
- LeafletJS - 標記
- LeafletJS - 向量圖層
- LeafletJS - 多線 & 多邊形
- LeafletJS - 圖層組
- LeafletJS - 事件處理
- LeafletJS - 疊加層
- LeafletJS - 控制元件
- LeafletJS 有用資源
- LeafletJS - 快速指南
- LeafletJS - 有用資源
- LeafletJS - 討論
LeafletJS - 多線和多邊形
在上一章中,我們學習瞭如何新增各種形狀,例如圓形、多邊形、矩形、多線段等。在本章中,讓我們討論如何新增多邊形、多矩形和多線段。
多線段
要使用 Leaflet JavaScript 庫在地圖上繪製多線段疊加層,請按照以下步驟操作:
步驟 1 − 透過傳遞 <div> 元素(字串或物件)和地圖選項(可選)來建立一個 Map 物件。
步驟 2 − 透過傳遞所需瓦片的 URL 來建立一個 Layer 物件。
步驟 3 − 使用 Map 類的 addLayer() 方法將圖層物件新增到地圖。
步驟 4 − 建立一個 latlangs 變數來儲存繪製多線段的點。
// Creating latlng object
var latlang = [
   [[17.385044, 78.486671], [16.506174, 80.648015], [17.686816, 83.218482]],
   [[13.082680, 80.270718], [12.971599, 77.594563],[15.828126, 78.037279]]
];
步驟 5 − 使用 L.multiPolyline() 函式建立一個多線段。將位置作為變數傳遞以繪製多線段,並使用選項指定線的顏色和粗細。
// Creating multi polyline options
var multiPolyLineOptions = {color:'red'};

// Creating multi polylines
var multipolyline = L.multiPolyline(latlang , multiPolyLineOptions);
步驟 6 − 使用 Multipolyline 類的 addTo() 方法將多線段新增到地圖。
// Adding multi polyline to map
multipolyline.addTo(map);
示例
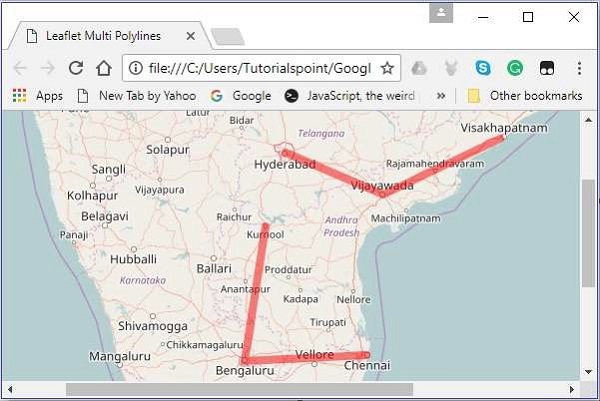
以下是繪製覆蓋海德拉巴、維傑亞瓦達和維沙卡帕特南;以及庫爾諾爾、班加羅爾和欽奈等城市的程式碼。
<!DOCTYPE html>
<html>
   <head>
      <title>Leaflet Multi Polylines</title>
      <link rel = "stylesheet" href = "http://cdn.leafletjs.com/leaflet-0.7.3/leaflet.css"/>
      <script src = "http://cdn.leafletjs.com/leaflet-0.7.3/leaflet.js"></script>
   </head>

   <body>
      <div id = "map" style = "width: 900px; height: 580px"></div>
      <script>
         // Creating map options
         var mapOptions = {
            center: [16.506174, 80.648015],
            zoom: 7
         }
         // Creating a map object
         var map = new L.map('map', mapOptions);

         // Creating a Layer object
         var layer = new L.TileLayer('http://{s}.tile.openstreetmap.org/{z}/{x}/{y}.png');

         // Adding layer to the map
         map.addLayer(layer);

         // Creating latlng object
         var latlang = [
            [[17.385044, 78.486671], [16.506174, 80.648015], [17.686816, 83.218482]],
            [[13.082680, 80.270718], [12.971599, 77.594563],[15.828126, 78.037279]]
         ];

         // Creating poly line options
         var multiPolyLineOptions = {color:'red'};

         // Creating multi poly-lines
         var multipolyline = L.multiPolyline(latlang , multiPolyLineOptions);

         // Adding multi poly-line to map
         multipolyline.addTo(map);
      </script>
   </body>

</html>
它會生成以下輸出:
多邊形
要使用 Leaflet JavaScript 庫在地圖上繪製多邊形疊加層,請按照以下步驟操作:
步驟 1 − 透過傳遞 <div> 元素(字串或物件)和地圖選項(可選)來建立一個 Map 物件。
步驟 2 − 透過傳遞所需瓦片的 URL 來建立一個 Layer 物件。
步驟 3 − 使用 Map 類的 addLayer() 方法將圖層物件新增到地圖。
步驟 4 − 建立一個 latlangs 變數來儲存繪製多邊形的點。
// Creating latlng object
var latlang = [
   [[17.385044, 78.486671], [16.506174, 80.648015], [17.686816, 83.218482]],
   [[13.082680, 80.270718], [12.971599, 77.594563],[15.828126, 78.037279]]
];
步驟 5 − 使用 L.multiPolygon() 函式建立一個多邊形。將位置作為變數傳遞以繪製多邊形,並使用選項指定線的顏色和粗細。
// Creating multi polygon options
var multiPolygonOptions = {color:'red'};

// Creating multi polygon
var multipolygon = L.multiPolygon(latlang , multiPolygonOptions);
步驟 6 − 使用 MultiPolygon 類的 addTo() 方法將多邊形新增到地圖。
// Adding multi polygon to map
multipolygon.addTo(map);
示例
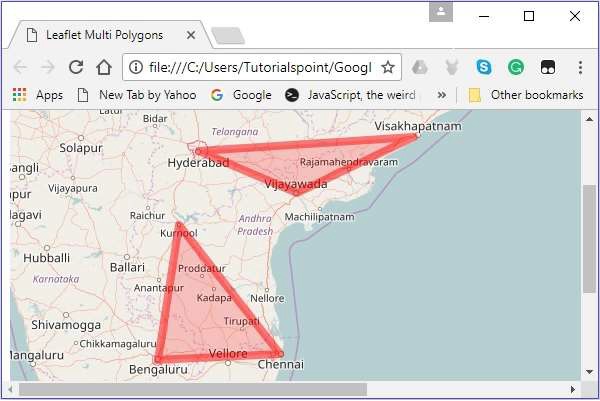
以下是繪製經過海德拉巴、維傑亞瓦達和維沙卡帕特南;以及庫爾諾爾、班加羅爾和欽奈等城市的程式碼。
<!DOCTYPE html>
<html>
   <head>
      <title>Leaflet Multi Polygons</title>
      <link rel = "stylesheet" href = "http://cdn.leafletjs.com/leaflet-0.7.3/leaflet.css"/>
      <script src = "http://cdn.leafletjs.com/leaflet-0.7.3/leaflet.js"></script>
   </head>

   <body>
      <div id = "map" style = "width: 900px; height: 580px"></div>
      <script>
         // Creating map options
         var mapOptions = {
            center: [16.506174, 80.648015],
            zoom: 7
         }
         // Creating a map object
         var map = new L.map('map', mapOptions);

         // Creating a Layer object
         var layer = new L.TileLayer('http://{s}.tile.openstreetmap.org/{z}/{x}/{y}.png');

         // Adding layer to the map
         map.addLayer(layer);

         // Creating latlng object
         var latlang = [
            [[17.385044, 78.486671], [16.506174, 80.648015], [17.686816, 83.218482]],
            [[13.082680, 80.270718], [12.971599, 77.594563],[15.828126, 78.037279]]
         ];
         // Creating multi polygon options
         var multiPolygonOptions = {color:'red', weight:8};

         // Creating multi polygons
         var multipolygon = L.multiPolygon(latlang , multiPolygonOptions);

         // Adding multi polygon to map
         multipolygon.addTo(map);
      </script>
   </body>

</html>
它會生成以下輸出: