- LeafletJS 教程
- LeafletJS - 首頁
- LeafletJS - 入門
- LeafletJS - 標記
- LeafletJS - 向量圖層
- LeafletJS - 多線段和多邊形
- LeafletJS - 圖層組
- LeafletJS - 事件處理
- LeafletJS - 疊加層
- LeafletJS - 控制元件
- LeafletJS 有用資源
- LeafletJS 快速指南
- LeafletJS - 有用資源
- LeafletJS - 討論
LeafletJS 快速指南
LeafletJS - 入門
什麼是 Leaflet.js
Leaflet.js 是一個開源庫,我們可以使用它來部署簡單、互動式、輕量級的網頁地圖。
Leaflet JavaScript 庫允許您使用圖層,例如瓦片圖層、WMS、標記、彈出視窗、向量圖層(折線、多邊形、圓形等)、影像疊加層和 GeoJSON。
您可以透過拖動地圖、縮放(雙擊或滾輪滾動)、使用鍵盤、使用事件處理以及拖動標記來與 Leaflet 地圖進行互動。
Leaflet 支援 Chrome、Firefox、Safari 5+、Opera 12+、IE 7–11 等桌面瀏覽器,以及 Safari、Android、Chrome、Firefox 等移動瀏覽器。
在網頁上載入地圖的步驟
請按照以下步驟在您的網頁上載入地圖:
步驟 1:建立 HTML 頁面
建立一個基本的 HTML 頁面,包含 head 和 body 標籤,如下所示:
<!DOCTYPE html>
<html>
   <head>
   </head>

   <body>
      ...........
   </body>
</html>
步驟 2:載入 Leaflet CSS 指令碼
在示例中包含 Leaflet CSS 指令碼:
<head>
   <link rel = "stylesheet" href = "http://cdn.leafletjs.com/leaflet-0.7.3/leaflet.css" />
</head>
步驟 3:載入 Leaflet 指令碼
使用 script 標籤載入或包含 Leaflet API:
<head>
   <script src = "http://cdn.leafletjs.com/leaflet-0.7.3/leaflet.js"></script>
</head>
步驟 4:建立容器
為了容納地圖,我們必須建立一個容器元素。通常,<div> 標籤(一個通用容器)用於此目的。
建立一個容器元素並定義其尺寸:
<div id = "sample" style = "width:900px; height:580px;"></div>
步驟 5:地圖選項
Leaflet 提供了多個選項,例如控制元件選項、互動選項、地圖狀態選項、動畫選項等。透過為這些選項設定值,我們可以根據需要自定義地圖。
建立一個 mapOptions 物件(它就像一個字面量一樣建立)併為中心和縮放選項設定值,其中
center - 作為此選項的值,您需要傳遞一個 LatLng 物件,指定我們想要將地圖居中的位置。(只需在 [] 花括號中指定緯度和經度值)
zoom - 作為此選項的值,您需要傳遞一個整數,表示地圖的縮放級別,如下所示。
var mapOptions = {
   center: [17.385044, 78.486671],
   zoom: 10
}
步驟 6:建立地圖物件
使用 Leaflet API 的 Map 類,您可以在頁面上建立地圖。您可以透過例項化 Leaflet API 的 Map 來建立地圖物件。在例項化此類時,您需要傳遞兩個引數:
作為此選項的引數,您需要傳遞一個字串變數,表示 DOM id 或 <div> 元素的例項。此處,<div> 元素是一個 HTML 容器,用於容納地圖。
一個可選的物件字面量,包含地圖選項。
透過傳遞 <div> 元素的 id 和在上一步中建立的 mapOptions 物件來建立地圖物件。
var map = new L.map('map', mapOptions);
步驟 7:建立圖層物件
您可以透過例項化 TileLayer 類來載入和顯示各種型別的地圖(瓦片圖層)。在例項化它時,您需要以字串變數的形式傳遞一個 URL 模板,從服務提供商請求所需的瓦片圖層(地圖)。
如下所示建立瓦片圖層物件。
var layer = new L.TileLayer('http://{s}.tile.openstreetmap.org/{z}/{x}/{y}.png');
這裡我們使用了 openstreetmap。
步驟 8:將圖層新增到地圖
最後,使用 addlayer() 方法將上一步中建立的圖層新增到地圖物件,如下所示。
map.addLayer(layer);
示例
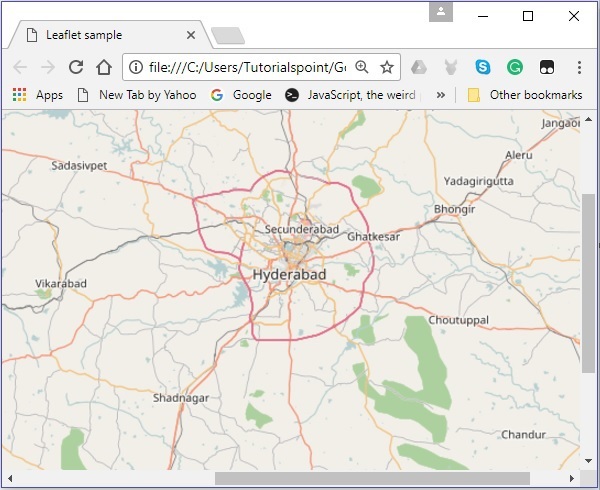
以下示例顯示瞭如何載入海德拉巴市(印度)的 open street map,縮放值為 10。
<!DOCTYPE html>
<html>
   <head>
      <title>Leaflet sample</title>
      <link rel = "stylesheet" href = "http://cdn.leafletjs.com/leaflet-0.7.3/leaflet.css"/>
      <script src = "http://cdn.leafletjs.com/leaflet-0.7.3/leaflet.js"></script>
   </head>

   <body>
      <div id = "map" style = "width: 900px; height: 580px"></div>
      <script>
         // Creating map options
         var mapOptions = {
            center: [17.385044, 78.486671],
            zoom: 10
         }

         // Creating a map object
         var map = new L.map('map', mapOptions);

         // Creating a Layer object
         var layer = new L.TileLayer('http://{s}.tile.openstreetmap.org/{z}/{x}/{y}.png');

         // Adding layer to the map
         map.addLayer(layer);
      </script>
   </body>

</html>
它生成以下輸出:
Leaflet 地圖提供商
就像 open street map 一樣,您可以載入各種服務提供商的圖層,例如 Open Topo、Thunder forest、Hydda、ESRI、Open weather、NASA GIBS 等。為此,您需要在建立 TileLayer 物件時傳遞其相應的 URL。
var layer = new L.TileLayer('URL of the required map');
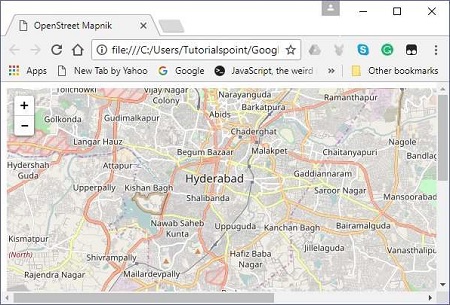
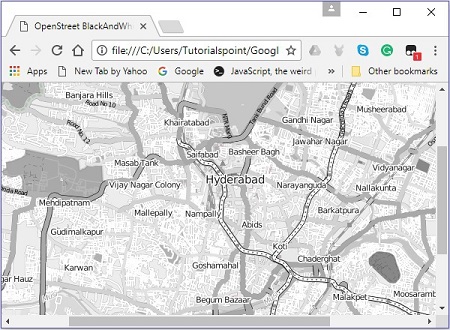
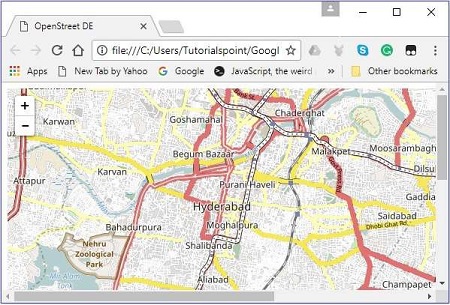
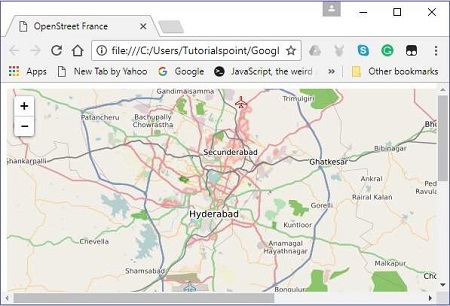
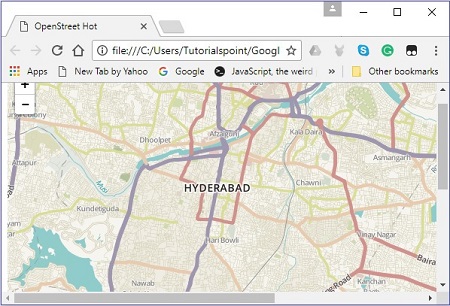
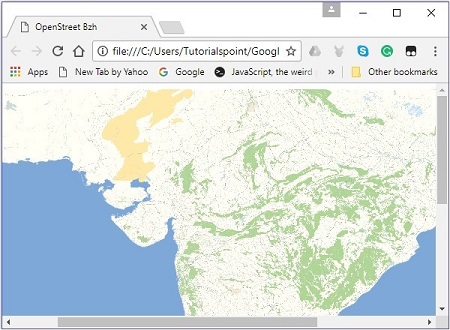
下表列出了 Openstreetmap 提供的圖層的 URL 及其相應的示例地圖。
| 地圖型別 | URL 和輸出 |
|---|---|
| Mapnik | http://{s}.tile.openstreetmap.org/{z}/{x}/{y}.png
|
| 黑白 | http://{s}.tiles.wmflabs.org/bw-mapnik/{z}/{x}/{y}.png
|
| DE | http://{s}.tile.openstreetmap.de/tiles/osmde/{z}/{x}/ {y}.png
|
| 法國 | http://{s}.tile.openstreetmap.fr/osmfr/{z}/{x}/{y}.png
|
| 熱力圖 | http://{s}.tile.openstreetmap.fr/hot/{z}/{x}/{y}.png
|
| BZH | http://tile.openstreetmap.bzh/br/{z}/{x}/{y}.png
|
LeafletJS - 標記
為了在地圖上標記單個位置,Leaflet 提供了標記。這些標記使用標準符號,並且可以自定義這些符號。在本章中,我們將瞭解如何新增標記以及如何自定義、動畫和刪除它們。
新增簡單標記
要使用 Leaflet JavaScript 庫在地圖上新增標記,請按照以下步驟操作:
步驟 1 - 透過傳遞 <div> 元素(字串或物件)和地圖選項(可選)來建立 Map 物件。
步驟 2 - 透過傳遞所需瓦片的 URL 來建立 Layer 物件。
步驟 3 - 使用 Map 類的 addLayer() 方法將圖層物件新增到地圖。
步驟 4 - 透過傳遞表示要標記位置的 latlng 物件來例項化 Marker 類,如下所示。
// Creating a marker
var marker = new L.Marker([17.385044, 78.486671]);
步驟 5 - 使用 Marker 類的 addTo() 方法將上一步中建立的標記物件新增到地圖。
// Adding marker to the map
marker.addTo(map);
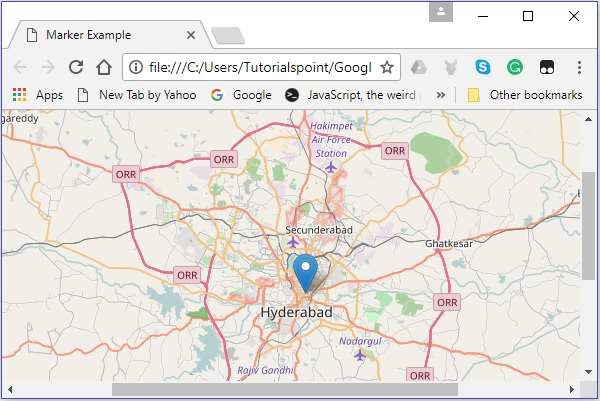
示例
以下程式碼將標記設定在名為海德拉巴(印度)的城市上。
<!DOCTYPE html>
<html>
   <head>
      <title>Leaflet sample</title>
      <link rel = "stylesheet" href = "http://cdn.leafletjs.com/leaflet-0.7.3/leaflet.css"/>
      <script src = "http://cdn.leafletjs.com/leaflet-0.7.3/leaflet.js"></script>
   </head>

   <body>
      <div id = "map" style = "width:900px; height:580px"></div>
      <script>
         // Creating map options
         var mapOptions = {
            center: [17.385044, 78.486671],
            zoom: 10
         }
         // Creating a map object
         var map = new L.map('map', mapOptions);

         // Creating a Layer object
         var layer = new L.TileLayer('http://{s}.tile.openstreetmap.org/{z}/{x}/{y}.png');

         // Adding layer to the map
         map.addLayer(layer);

         // Creating a marker
         var marker = L.marker([17.385044, 78.486671]);

         // Adding marker to the map
         marker.addTo(map);
      </script>
   </body>

</html>
它生成以下輸出:
將彈出視窗繫結到標記
要將顯示訊息的簡單彈出視窗繫結到標記,請按照以下步驟操作:
步驟 1 - 透過傳遞 <div> 元素(字串或物件)和地圖選項(可選)來建立 Map 物件。
步驟 2 - 透過傳遞所需瓦片的 URL 來建立 Layer 物件。
步驟 3 - 使用 Map 類的 addLayer() 方法將圖層物件新增到地圖。
步驟 4 - 透過傳遞表示要標記位置的 latlng 物件來例項化 Marker 類。
步驟 5 - 使用 bindPopup() 將彈出視窗附加到標記,如下所示。
// Adding pop-up to the marker
marker.bindPopup('Hi Welcome to Tutorialspoint').openPopup();
步驟 6 - 最後,使用 Marker 類的 addTo() 方法將上一步中建立的 Marker 物件新增到地圖。
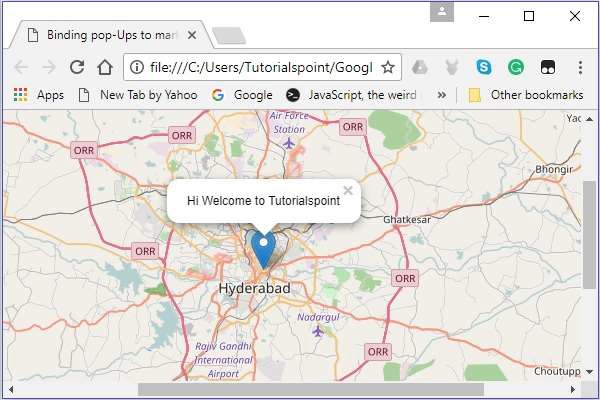
示例
以下程式碼將標記設定在海德拉巴(印度)市,並向其新增一個彈出視窗。
<!DOCTYPE html>
<html>
   <head>
      <title>Binding pop-Ups to marker</title>
      <link rel = "stylesheet" href = "http://cdn.leafletjs.com/leaflet-0.7.3/leaflet.css"/>
      <script src = "http://cdn.leafletjs.com/leaflet-0.7.3/leaflet.js"></script>
   </head>

   <body>
      <div id = "map" style = "width:900px; height:580px"></div>
      <script>
         // Creating map options
         var mapOptions = {
            center: [17.385044, 78.486671],
            zoom: 15
         }
         var map = new L.map('map', mapOptions); // Creating a map object

         // Creating a Layer object
         var layer = new L.TileLayer('http://{s}.tile.openstreetmap.org/{z}/{x}/{y}.png');
         map.addLayer(layer);         // Adding layer to the map
         var marker = L.marker([17.438139, 78.395830]);    // Creating a Marker

         // Adding popup to the marker
         marker.bindPopup('This is Tutorialspoint').openPopup();
         marker.addTo(map); // Adding marker to the map
      </script>
   </body>

</html>
它生成以下輸出
標記選項
在建立標記時,您還可以除了 latlang 物件之外,還可以傳遞 marker options 變數。使用此變數,您可以為標記的各種選項設定值,例如圖示、可拖動、鍵盤、標題、alt、zInsexOffset、不透明度、懸停時升起、升起偏移量、面板、可拖動等。
要使用地圖選項建立地圖,您需要按照以下步驟操作:
步驟 1 - 透過傳遞 <div> 元素(字串或物件)和地圖選項(可選)來建立 Map 物件。
步驟 2 - 透過傳遞所需瓦片的 URL 來建立 Layer 物件。
步驟 3 - 使用 Map 類的 addLayer() 方法將圖層物件新增到地圖。
步驟 4 - 為 markerOptions 建立一個變數,併為所需的選項指定值。
建立一個 markerOptions 物件(它就像一個字面量一樣建立)併為 iconUrl 和 iconSize 選項設定值。
// Options for the marker
var markerOptions = {
   title: "MyLocation",
   clickable: true,
   draggable: true
}
步驟 5 - 透過傳遞表示要標記位置的 latlng 物件和上一步中建立的選項物件來例項化 Marker 類。
// Creating a marker
var marker = L.marker([17.385044, 78.486671], markerOptions);
步驟 6 - 最後,使用 Marker 類的 addTo() 方法將上一步中建立的 Marker 物件新增到地圖。
示例
以下程式碼將標記設定在海德拉巴(印度)市。此標記是可點選的,可拖動,標題為 MyLocation。
<html>
   <head>
      <title>Marker Options Example</title>
      <link rel = "stylesheet" href = "http://cdn.leafletjs.com/leaflet-0.7.3/leaflet.css"/>
      <script src = "http://cdn.leafletjs.com/leaflet-0.7.3/leaflet.js"></script>
   </head>

   <body>
      <div id = "map" style = "width:900px; height:580px"></div>
      <script>
         // Creating map options
         var mapOptions = {
            center: [17.385044, 78.486671],
            zoom: 10
         }
         // Creating a map object
         var map = new L.map('map', mapOptions);

         // Creating a Layer object
         var layer = new L.TileLayer('http://{s}.tile.openstreetmap.org/{z}/{x}/{y}.png');

         // Adding layer to the map
         map.addLayer(layer);

         // Creating a Marker
         var markerOptions = {
            title: "MyLocation",
            clickable: true,
            draggable: true
         }
         // Creating a marker
         var marker = L.marker([17.385044, 78.486671], markerOptions);

         // Adding marker to the map
         marker.addTo(map);
      </script>
   </body>

</html>
它生成以下輸出

標記自定義圖示
除了 Leaflet 庫提供的預設圖示外,您還可以新增自己的圖示。您可以使用以下步驟將自定義圖示新增到地圖,而不是預設圖示。
步驟 1 - 透過傳遞 <div> 元素(字串或物件)和地圖選項(可選)來建立 Map 物件。
步驟 2 - 透過傳遞所需瓦片的 URL 來建立 Layer 物件。
步驟 3 - 使用 Map 類的 addLayer() 方法將圖層物件新增到地圖。
步驟 4 - 為 markerOptions 建立一個變數,併為所需的選項指定值:
iconUrl - 作為此選項的值,您需要傳遞一個 String 物件,指定您要用作圖示的影像的路徑。
iconSize - 使用此選項,您可以指定圖示的大小。
注意 - 除了這些之外,您還可以為其他選項設定值,例如 iconSize、shadowSize、iconAnchor、shadowAnchor 和 popupAnchor。
透過傳遞上述選項變數來使用 L.icon() 建立自定義圖示,如下所示。
// Icon options
var iconOptions = {
   iconUrl: 'logo.png',
   iconSize: [50, 50]
}

// Creating a custom icon
var customIcon = L.icon(iconOptions);
步驟 5 - 為 markerOptions 建立一個變數,併為所需的選項指定值。此外,透過將上一步中建立的 icon 變數作為值傳遞來指定圖示。
// Options for the marker
var markerOptions = {
   title: "MyLocation",
   clickable: true,
   draggable: true,
   icon: customIcon
}
步驟 6 - 透過傳遞表示要標記位置的 latlng 物件和上一步中建立的選項物件來例項化 Marker 類。
// Creating a marker
var marker = L.marker([17.438139, 78.395830], markerOptions);
步驟 7 - 最後,使用 Marker 類的 addTo() 方法將上一步中建立的 Marker 物件新增到地圖。
示例
以下程式碼將標記設定在 Tutorialspoint 的位置。這裡我們使用 Tutorialspoint 的 logo 而不是預設標記。
<!DOCTYPE html>
<html>
   <head>
      <title>Marker Custom Icons Example</title>
      <link rel = "stylesheet" href = "http://cdn.leafletjs.com/leaflet-0.7.3/leaflet.css"/>
      <script src = "http://cdn.leafletjs.com/leaflet-0.7.3/leaflet.js"></script>
   </head>

   <body>
      <div id = "map" style = "width:900px; height:580px"></div>
      <script>
         // Creating map options
         var mapOptions = {
            center: [17.438139, 78.395830],
            zoom: 10
         }
         // Creating a map object
         var map = new L.map('map', mapOptions);

         // Creating a Layer object
         var layer = new L.TileLayer('http://{s}.tile.openstreetmap.org/{z}/{x}/{y}.png');

         // Adding layer to the map
         map.addLayer(layer);

         // Icon options
         var iconOptions = {
            iconUrl: 'logo.png',
            iconSize: [50, 50]
         }
         // Creating a custom icon
         var customIcon = L.icon(iconOptions);

         // Creating Marker Options
         var markerOptions = {
            title: "MyLocation",
            clickable: true,
            draggable: true,
            icon: customIcon
         }
         // Creating a Marker
         var marker = L.marker([17.438139, 78.395830], markerOptions);

         // Adding popup to the marker
         marker.bindPopup('Hi welcome to Tutorialspoint').openPopup();

         // Adding marker to the map
         marker.addTo(map);
      </script>
   </body>

</html>
它生成以下輸出
LeafletJS - 向量圖層
在上一章中,我們學習瞭如何在 Leaflet 中使用標記。除了標記之外,我們還可以新增各種形狀,例如圓形、多邊形、矩形、折線等。在本章中,我們將討論如何使用 Google Maps 提供的形狀。
折線
要使用 Leaflet JavaScript 庫在地圖上繪製折線疊加層,請按照以下步驟操作:
步驟 1 - 透過傳遞 <div> 元素(字串或物件)和地圖選項(可選)來建立 Map 物件。
步驟 2 - 透過傳遞所需瓦片的 URL 來建立 Layer 物件。
步驟 3 - 使用 Map 類的 addLayer() 方法將圖層物件新增到地圖。
步驟 4 - 建立一個 latlangs 變數來儲存繪製折線的點,如下所示。
// Creating latlng object
var latlngs = [
   [17.385044, 78.486671],
   [16.506174, 80.648015],
   [17.000538, 81.804034],
   [17.686816, 83.218482]
];
步驟 5 - 使用 L.polyline() 建立折線。要繪製折線,請將位置作為變數傳遞,以及一個選項來指定線條的顏色。
// Creating a poly line
var polyline = L.polyline(latlngs, {color: 'red'});
步驟 6 - 使用 Polyline 類的 addTo() 方法將折線新增到地圖。
// Adding to poly line to map
polyline.addTo(map);
示例
以下是繪製折線的程式碼,覆蓋海德拉巴、維賈亞瓦達、拉賈馬亨德拉瓦拉姆和維沙卡帕特南(印度)等城市。
DOCTYPE html>
<html>
   <head>
      <title>Leaflet Poly lines</title>
      <link rel = "stylesheet" href = "http://cdn.leafletjs.com/leaflet-0.7.3/leaflet.css"/>
      <script src = "http://cdn.leafletjs.com/leaflet-0.7.3/leaflet.js"></script>
   </head>

   <body>
      <div id = "map" style = "width:900px; height:580px"></div>
      <script>
         // Creating map options
         var mapOptions = {
            center: [16.506174, 80.648015],
            zoom: 7
         }
         // Creating a map object
         var map = new L.map('map', mapOptions);

         // Creating a Layer object
         var layer = new L.TileLayer('http://{s}.tile.openstreetmap.org/{z}/{x}/{y}.png');

         // Adding layer to the map
         map.addLayer(layer);

         // Creating latlng object
         var latlngs = [
            [17.385044, 78.486671],
            [16.506174, 80.648015],
            [17.000538, 81.804034],
            [17.686816, 83.218482]
         ];
         // Creating a poly line
         var polyline = L.polyline(latlngs, {color: 'red'});

         // Adding to poly line to map
         polyline.addTo(map);
      </script>
   </body>

</html>
它生成以下輸出

多邊形
要使用 Leaflet JavaScript 庫在地圖上繪製多邊形疊加層,請按照以下步驟操作:
步驟 1 - 透過傳遞 <div> 元素(字串或物件)和地圖選項(可選)來建立 Map 物件。
步驟 2 - 透過傳遞所需瓦片的 URL 來建立 Layer 物件。
步驟 3 - 使用 Map 類的 addLayer() 方法將圖層物件新增到地圖。
步驟 4 - 建立一個 latlangs 變數來儲存繪製多邊形的點。
// Creating latlng object
var latlngs = [
   [17.385044, 78.486671],
   [16.506174, 80.648015],
   [17.686816, 83.218482]
];
步驟 5 - 使用 L.polygon() 建立多邊形。將位置/點作為變數傳遞以繪製多邊形,以及一個選項來指定多邊形的顏色。
// Creating a polygon
var polygon = L.polygon(latlngs, {color: 'red'});
步驟 6 - 使用 Polygon 類的 addTo() 方法將多邊形新增到地圖。
// Adding to polygon to map
polygon.addTo(map);
示例
以下是繪製多邊形的程式碼,覆蓋海德拉巴、維賈亞瓦達和維沙卡帕特南(印度)等城市。
<!DOCTYPE html>
<html>
   <head>
      <title>Leaflet Polygons</title>
      <link rel = "stylesheet" href = "http://cdn.leafletjs.com/leaflet-0.7.3/leaflet.css"/>
      <script src = "http://cdn.leafletjs.com/leaflet-0.7.3/leaflet.js"></script>
   </head>

   <body>
      <div id = "map" style = "width:900px; height:580px"></div>
      <script>
         // Creating map options
         var mapOptions = {
            center: [16.506174, 80.648015],
            zoom: 7
         }
         // Creating a map object
         var map = new L.map('map', mapOptions);

         // Creating a Layer object
         var layer = new L.TileLayer('http://{s}.tile.openstreetmap.org/{z}/{x}/{y}.png');

         // Adding layer to the map
         map.addLayer(layer);

         // Creating latlng object
         var latlngs = [
            [17.385044, 78.486671],
            [16.506174, 80.648015],
            [17.686816, 83.218482]
         ];
         // Creating a polygon
         var polygon = L.polygon(latlngs, {color: 'red'});

         // Adding to polygon to map
         polygon.addTo(map);
      </script>
   </body>

</html>
它生成以下輸出:

矩形
要使用 Leaflet JavaScript 庫在地圖上繪製矩形疊加層,請按照以下步驟操作
步驟 1 - 透過傳遞 <div> 元素(字串或物件)和地圖選項(可選)來建立 Map 物件。
步驟 2 - 透過傳遞所需瓦片的 URL 來建立 Layer 物件。
步驟 3 - 使用 Map 類的 addLayer() 方法將圖層物件新增到地圖。
步驟 4 - 建立一個 latlangs 變數來儲存在地圖上繪製矩形的點。
// Creating latlng object
var latlngs = [
   [17.342761, 78.552432],
   [16.396553, 80.727725]
];
步驟 5 - 使用 L.rectangle() 函式建立矩形。將位置/點作為變數傳遞以繪製矩形,以及 rectangleOptions 來指定矩形的顏色和粗細。
// Creating rectOptions
var rectOptions = {color: 'Red', weight: 1}

// Creating a rectangle
var rectangle = L.rectangle(latlngs, rectOptions);
步驟 6 − 使用Polygon類的addTo()方法將矩形新增到地圖上。
// Adding to rectangle to map
rectangle.addTo(map);
示例
以下是使用Leaflet JavaScript庫在地圖上繪製矩形的程式碼。
<!DOCTYPE html>
<html>
   <head>
      <title>Leaflet Rectangle</title>
      <link rel = "stylesheet" href = "http://cdn.leafletjs.com/leaflet-0.7.3/leaflet.css"/>
      <script src = "http://cdn.leafletjs.com/leaflet-0.7.3/leaflet.js"></script>
   </head>

   <body>
      <div id = "map" style = "width:900px; height:580px"></div>
      <script>
         // Creating map options
         var mapOptions = {
            center: [16.506174, 80.648015],
            zoom: 7
         }
         var map = new L.map('map', mapOptions); // Creating a map object

         // Creating a Layer object
         var layer = new L.TileLayer('http://{s}.tile.openstreetmap.org/{z}/{x}/{y}.png');
         map.addLayer(layer); // Adding layer to the map

         // Creating latlng object
         var latlngs = [
            [17.342761, 78.552432],
            [16.396553, 80.727725]
         ];
         var rectOptions = {color: 'Red', weight: 1}   // Creating rectOptions

         // Creating a rectangle
         var rectangle = L.rectangle(latlngs, rectOptions);
         rectangle.addTo(map);   // Adding to rectangle to map
      </script>
   </body>

</html>
它生成以下輸出:

圓形
要使用Leaflet JavaScript庫在地圖上繪製圓形疊加層,請按照以下步驟操作。
步驟 1 - 透過傳遞 <div> 元素(字串或物件)和地圖選項(可選)來建立 Map 物件。
步驟 2 - 透過傳遞所需瓦片的 URL 來建立 Layer 物件。
步驟 3 - 使用 Map 類的 addLayer() 方法將圖層物件新增到地圖。
步驟 4 − 建立一個latlangs變數來儲存圓心的座標,如下所示。
// Center of the circle
var circleCenter = [17.385044, 78.486671];
步驟 5 − 建立一個變數circleOptions來指定選項color、fillColor和fillOpacity的值,如下所示。
// Circle options
var circleOptions = {
   color: 'red',
   fillColor: '#f03',
   fillOpacity: 0
}
步驟 6 − 使用L.circle()建立一個圓形。將圓心、半徑和圓形選項傳遞給此函式。
// Creating a circle
var circle = L.circle(circleCenter, 50000, circleOptions);
步驟 7 − 使用Polyline類的addTo()方法將上面建立的圓形新增到地圖上。
// Adding circle to the map
circle.addTo(map);
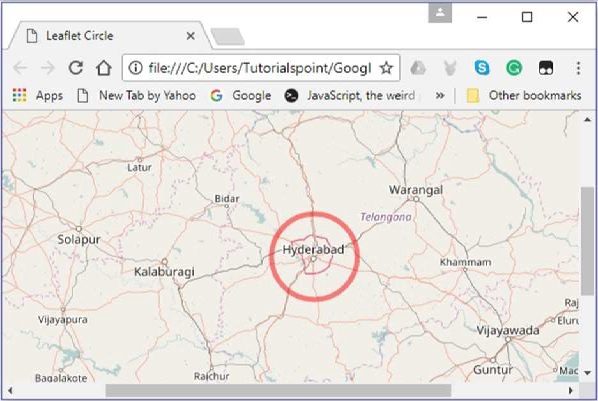
示例
以下是使用海德拉巴市座標作為半徑繪製圓形的程式碼。
<!DOCTYPE html>
<html>
   <head>
      <title>Leaflet Circle</title>
      <link rel = "stylesheet" href = "http://cdn.leafletjs.com/leaflet-0.7.3/leaflet.css"/>
      <script src = "http://cdn.leafletjs.com/leaflet-0.7.3/leaflet.js"></script>
   </head>

   <body>
      <div id = "map" style = "width: 900px; height: 580px"></div>
      <script>
         // Creating map options
         var mapOptions = {
            center: [17.385044, 78.486671],
            zoom: 7
         }
         var map = new L.map('map', mapOptions); // Creating a map object

         // Creating a Layer object
         var layer = new L.TileLayer('http://{s}.tile.openstreetmap.org/{z}/{x}/{y}.png');
         map.addLayer(layer);        // Adding layer to the map
         var circleCenter = [17.385044, 78.486671];     // Center of the circle

         // Circle options
         var circleOptions = {
            color: 'red',
            fillColor: '#f03',
            fillOpacity: 0
         }
         // Creating a circle
         var circle = L.circle(circleCenter, 50000, circleOptions);
         circle.addTo(map);     // Adding circle to the map
      </script>
   </body>

</html>>
它生成以下輸出:
LeafletJS - 多條折線和多邊形
在上一章中,我們學習瞭如何新增各種形狀,例如圓形、多邊形、矩形、折線等。在本章中,讓我們討論如何新增多邊形、多矩形和多條折線。
多條折線
要使用Leaflet JavaScript庫在地圖上繪製多條折線疊加層,請按照以下步驟操作:
步驟 1 - 透過傳遞 <div> 元素(字串或物件)和地圖選項(可選)來建立 Map 物件。
步驟 2 - 透過傳遞所需瓦片的 URL 來建立 Layer 物件。
步驟 3 - 使用 Map 類的 addLayer() 方法將圖層物件新增到地圖。
步驟 4 − 建立一個latlangs變數來儲存繪製多條折線的點的座標。
// Creating latlng object
var latlang = [
   [[17.385044, 78.486671], [16.506174, 80.648015], [17.686816, 83.218482]],
   [[13.082680, 80.270718], [12.971599, 77.594563],[15.828126, 78.037279]]
];
步驟 5 − 使用L.multiPolyline()函式建立一個多條折線。將座標作為變數傳遞以繪製多條折線,並提供一個選項來指定線的顏色和粗細。
// Creating multi polyline options
var multiPolyLineOptions = {color:'red'};

// Creating multi polylines
var multipolyline = L.multiPolyline(latlang , multiPolyLineOptions);
步驟 6 − 使用Multipolyline類的addTo()方法將多條折線新增到地圖上。
// Adding multi polyline to map
multipolyline.addTo(map);
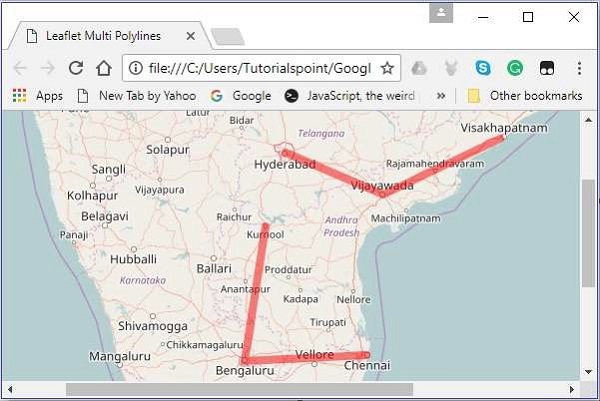
示例
以下是繪製覆蓋海德拉巴、維傑亞瓦達和維沙卡帕特南;以及庫爾努爾、班加羅爾和欽奈等城市的程式碼。
<!DOCTYPE html>
<html>
   <head>
      <title>Leaflet Multi Polylines</title>
      <link rel = "stylesheet" href = "http://cdn.leafletjs.com/leaflet-0.7.3/leaflet.css"/>
      <script src = "http://cdn.leafletjs.com/leaflet-0.7.3/leaflet.js"></script>
   </head>

   <body>
      <div id = "map" style = "width: 900px; height: 580px"></div>
      <script>
         // Creating map options
         var mapOptions = {
            center: [16.506174, 80.648015],
            zoom: 7
         }
         // Creating a map object
         var map = new L.map('map', mapOptions);

         // Creating a Layer object
         var layer = new L.TileLayer('http://{s}.tile.openstreetmap.org/{z}/{x}/{y}.png');

         // Adding layer to the map
         map.addLayer(layer);

         // Creating latlng object
         var latlang = [
            [[17.385044, 78.486671], [16.506174, 80.648015], [17.686816, 83.218482]],
            [[13.082680, 80.270718], [12.971599, 77.594563],[15.828126, 78.037279]]
         ];

         // Creating poly line options
         var multiPolyLineOptions = {color:'red'};

         // Creating multi poly-lines
         var multipolyline = L.multiPolyline(latlang , multiPolyLineOptions);

         // Adding multi poly-line to map
         multipolyline.addTo(map);
      </script>
   </body>

</html>
它生成以下輸出:
多邊形
要使用Leaflet JavaScript庫在地圖上繪製多邊形疊加層,請按照以下步驟操作:
步驟 1 - 透過傳遞 <div> 元素(字串或物件)和地圖選項(可選)來建立 Map 物件。
步驟 2 - 透過傳遞所需瓦片的 URL 來建立 Layer 物件。
步驟 3 - 使用 Map 類的 addLayer() 方法將圖層物件新增到地圖。
步驟 4 − 建立一個latlangs變數來儲存繪製多邊形的點的座標。
// Creating latlng object
var latlang = [
   [[17.385044, 78.486671], [16.506174, 80.648015], [17.686816, 83.218482]],
   [[13.082680, 80.270718], [12.971599, 77.594563],[15.828126, 78.037279]]
];
步驟 5 − 使用L.multiPolygon()函式建立一個多邊形。將座標作為變數傳遞以繪製多邊形,並提供一個選項來指定線的顏色和粗細。
// Creating multi polygon options
var multiPolygonOptions = {color:'red'};

// Creating multi polygon
var multipolygon = L.multiPolygon(latlang , multiPolygonOptions);
步驟 6 − 使用MultiPolygon類的addTo()方法將多邊形新增到地圖上。
// Adding multi polygon to map
multipolygon.addTo(map);
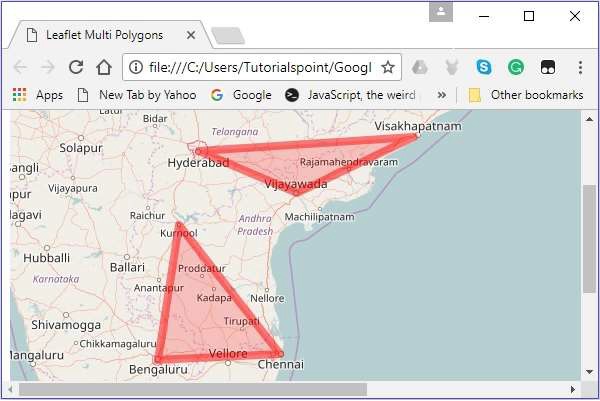
示例
以下是繪製一個與海德拉巴、維傑亞瓦達和維沙卡帕特南;以及庫爾努爾、班加羅爾和欽奈等城市相接的多邊形的程式碼。
<!DOCTYPE html>
<html>
   <head>
      <title>Leaflet Multi Polygons</title>
      <link rel = "stylesheet" href = "http://cdn.leafletjs.com/leaflet-0.7.3/leaflet.css"/>
      <script src = "http://cdn.leafletjs.com/leaflet-0.7.3/leaflet.js"></script>
   </head>

   <body>
      <div id = "map" style = "width: 900px; height: 580px"></div>
      <script>
         // Creating map options
         var mapOptions = {
            center: [16.506174, 80.648015],
            zoom: 7
         }
         // Creating a map object
         var map = new L.map('map', mapOptions);

         // Creating a Layer object
         var layer = new L.TileLayer('http://{s}.tile.openstreetmap.org/{z}/{x}/{y}.png');

         // Adding layer to the map
         map.addLayer(layer);

         // Creating latlng object
         var latlang = [
            [[17.385044, 78.486671], [16.506174, 80.648015], [17.686816, 83.218482]],
            [[13.082680, 80.270718], [12.971599, 77.594563],[15.828126, 78.037279]]
         ];
         // Creating multi polygon options
         var multiPolygonOptions = {color:'red', weight:8};

         // Creating multi polygons
         var multipolygon = L.multiPolygon(latlang , multiPolygonOptions);

         // Adding multi polygon to map
         multipolygon.addTo(map);
      </script>
   </body>

</html>
它生成以下輸出:
LeafletJS - 圖層組
圖層組
使用圖層組,您可以將多個圖層新增到地圖上,並將其作為一個圖層進行管理。
請按照以下步驟建立圖層組並將其新增到地圖上。
步驟 1 - 透過傳遞 <div> 元素(字串或物件)和地圖選項(可選)來建立 Map 物件。
步驟 2 - 透過傳遞所需瓦片的 URL 來建立 Layer 物件。
步驟 3 - 使用 Map 類的 addLayer() 方法將圖層物件新增到地圖。
步驟 4 − 透過例項化相應的類來建立所需的元素(圖層),例如標記、多邊形、圓形等,如下所示。
// Creating markers
var hydMarker = new L.Marker([17.385044, 78.486671]);
var vskpMarker = new L.Marker([17.686816, 83.218482]);
var vjwdMarker = new L.Marker([16.506174, 80.648015]);

// Creating latlng object
var latlngs = [
   [17.385044, 78.486671],
   [16.506174, 80.648015],
   [17.686816, 83.218482]
];
// Creating a polygon
var polygon = L.polygon(latlngs, {color: 'red'});
步驟 5 − 使用l.layerGroup()建立圖層組。傳遞上面建立的標記、多邊形等,如下所示。
// Creating layer group
var layerGroup = L.layerGroup([hydMarker, vskpMarker, vjwdMarker, polygon]);
步驟 6 − 使用addTo()方法新增上一步建立的圖層組。
// Adding layer group to map
layerGroup.addTo(map);
示例
以下程式碼建立了一個包含3個標記和一個多邊形的圖層組,並將其新增到地圖上。
<!DOCTYPE html>
<html>
   <head>
      <title>Leaflet Layer Group</title>
      <link rel = "stylesheet" href = "http://cdn.leafletjs.com/leaflet-0.7.3/leaflet.css"/>
      <script src = "http://cdn.leafletjs.com/leaflet-0.7.3/leaflet.js"></script>
   </head>

   <body>
      <div id = "map" style = "width: 900px; height: 580px"></div>
      <script>
         // Creating map options
         var mapOptions = {
            center: [17.385044, 78.486671],
            zoom: 7
         }
         var map = new L.map('map', mapOptions); // Creating a map object

         // Creating a Layer object
         var layer = new L.TileLayer('http://{s}.tile.openstreetmap.org/{z}/{x}/{y}.png');
         map.addLayer(layer);      // Adding layer to the map

         // Creating markers
         var hydMarker = new L.Marker([17.385044, 78.486671]);
         var vskpMarker = new L.Marker([17.686816, 83.218482]);
         var vjwdMarker = new L.Marker([16.506174, 80.648015]);

         // Creating latlng object
         var latlngs = [
            [17.385044, 78.486671],
            [16.506174, 80.648015],
            [17.686816, 83.218482]
         ];
         // Creating a polygon
         var polygon = L.polygon(latlngs, {color: 'red'});

         // Creating layer group
         var layerGroup = L.layerGroup([hydMarker, vskpMarker, vjwdMarker, polygon]);
         layerGroup.addTo(map);    // Adding layer group to map
      </script>
   </body>

</html>
它生成以下輸出:

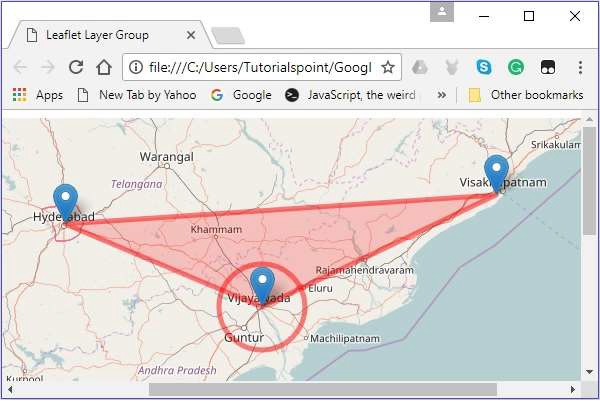
新增圖層(元素)
您可以使用addLayer()方法將圖層新增到要素組。此方法需要傳遞要新增的元素。
您可以新增一個以海德拉巴市為中心的圓形。
// Creating a circle
var circle = L.circle([16.506174, 80.648015], 50000, {color: 'red', fillColor:
   '#f03', fillOpacity: 0} );

// Adding circle to the layer group
layerGroup.addLayer(circle);
它將產生以下輸出:−
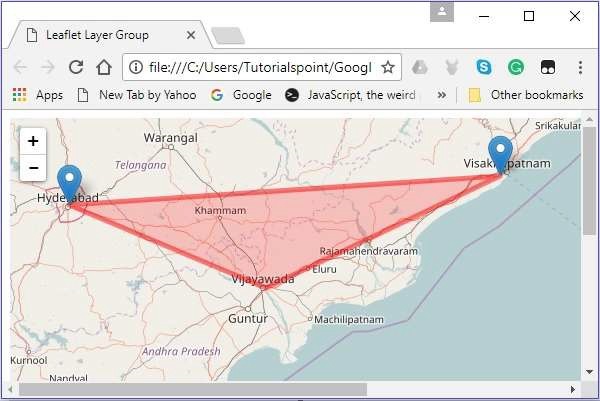
移除圖層(元素)
您可以使用removeLayer()方法從要素組中移除圖層。此方法需要傳遞要移除的元素。
您可以移除維傑亞瓦達市的標記,如下所示。
// Removing layer from map
layerGroup.removeLayer(vjwdMarker);
它將產生以下輸出:−
要素組
它類似於圖層組,但允許滑鼠事件並將其繫結到彈出視窗。您還可以使用setStyle()方法為整個組設定樣式。
請按照以下步驟建立要素組並將其新增到地圖上。
步驟 1 - 透過傳遞 <div> 元素(字串或物件)和地圖選項(可選)來建立 Map 物件。
步驟 2 - 透過傳遞所需瓦片的 URL 來建立 Layer 物件。
步驟 3 - 使用 Map 類的 addLayer() 方法將圖層物件新增到地圖。
步驟 4 − 透過例項化相應的類來建立所需的元素(圖層),例如標記、多邊形和圓形,如下所示。
// Creating markers
var hydMarker = new L.Marker([17.385044, 78.486671]);
var vskpMarker = new L.Marker([17.686816, 83.218482]);
var vjwdMarker = new L.Marker([16.506174, 80.648015]);

// Creating latlng object
var latlngs = [
   [17.385044, 78.486671],
   [16.506174, 80.648015],
   [17.686816, 83.218482]
];
// Creating a polygon
var polygon = L.polygon(latlngs, {color: 'red'});>
步驟 5 − 使用l.featureGroup()建立要素組。傳遞上面建立的標記、多邊形等,如下所示。
// Creating feature group
var featureGroup = L.featureGroup([hydMarker, vskpMarker, vjwdMarker, polygon]);
步驟 6 − 如果您為要素組設定樣式,它將應用於組中的每個元素(圖層)。您可以使用setStyle()方法執行此操作,並向此方法傳遞color和opacity等選項的值。
將樣式設定為上一步建立的要素組。
// Setting style to the feature group
featureGroup.setStyle({color:'blue',opacity:.5});
步驟 7 − 使用bindPopup()方法繫結彈出視窗,如下所示。
// Binding popup to the feature group
featureGroup.bindPopup("Feature Group");
步驟 8 − 使用addTo()方法新增上一步建立的要素組。
// Adding layer group to map
featureGroup.addTo(map);
示例
以下程式碼建立了一個包含3個標記和一個多邊形的要素組,並將其新增到地圖上。
<!DOCTYPE html>
<html>
   <head>
      <title>Leaflet Feature Group</title>
      <link rel = "stylesheet" href = "http://cdn.leafletjs.com/leaflet-0.7.3/leaflet.css"/>
      <script src = "http://cdn.leafletjs.com/leaflet-0.7.3/leaflet.js"></script>
   </head>

   <body>
      <div id = "map" style = "width:900px; height:580px"></div>
      <script>
         // Creating map options
         var mapOptions = {
            center: [17.385044, 78.486671],
            zoom: 7
         }
         var map = new L.map('map', mapOptions); // Creating a map object

         // Creating a Layer object
         var layer = new L.TileLayer('http://{s}.tile.openstreetmap.org/{z}/{x}/{y}.png');
         map.addLayer(layer);      // Adding layer to the map

         // Creating markers
         var hydMarker = new L.Marker([17.385044, 78.486671]);
         var vskpMarker = new L.Marker([17.686816, 83.218482]);
         var vjwdMarker = new L.Marker([16.506174, 80.648015]);

         // Creating latlng object
         var latlngs = [
            [17.385044, 78.486671],
            [16.506174, 80.648015],
            [17.686816, 83.218482]
         ];
         var polygon = L.polygon(latlngs, {color: 'red'}); // Creating a polygon

         // Creating feature group
         var featureGroup = L.featureGroup([hydMarker, vskpMarker, vjwdMarker, polygon]);
         featureGroup.setStyle({color:'blue',opacity:.5});
         featureGroup.bindPopup("Feature Group");
         featureGroup.addTo(map);      // Adding layer group to map
      </script>
   </body>

</html>
它生成以下輸出:

LeafletJS - 事件處理
Leaflet JavaScript程式可以響應使用者生成的各種事件。在本章中,我們將提供一些示例來演示如何在使用Leaflet時執行事件處理。
事件處理
請按照以下步驟將事件新增到地圖上。
步驟 1 - 透過傳遞 <div> 元素(字串或物件)和地圖選項(可選)來建立 Map 物件。
步驟 2 - 透過傳遞所需瓦片的 URL 來建立 Layer 物件。
步驟 3 - 使用 Map 類的 addLayer() 方法將圖層物件新增到地圖。
步驟 4 − 將處理程式新增到地圖上,如下所示。
map.on("click", function(e){
   new L.Marker([e.latlng.lat, e.latlng.lng]).addTo(map);
})
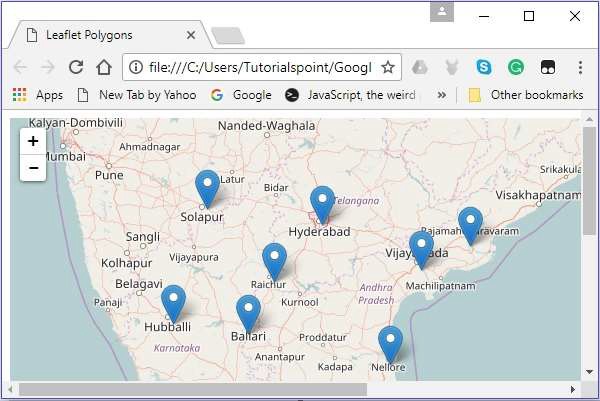
示例
以下程式碼演示了使用Leaflet進行事件處理。執行後,如果單擊地圖,則將在該特定位置建立一個標記。
<!DOCTYPE html>
<html>
   <head>
      <title>Leaflet Polygons</title>
      <link rel = "stylesheet" href = "http://cdn.leafletjs.com/leaflet-0.7.3/leaflet.css"/>
      <script src = "http://cdn.leafletjs.com/leaflet-0.7.3/leaflet.js"></script>
   </head>

   <body>
      <div id = "map" style = "width: 900px; height: 580px"></div>
      <script>
         // Creating map options
         var mapOptions = {
            center: [16.506174, 80.648015],
            zoom: 7
         }
         var map = new L.map('map', mapOptions);    // Creating a map object

         // Creating a Layer object
         var layer = new L.TileLayer('http://{s}.tile.openstreetmap.org/{z}/{x}/{y}.png');
         map.addLayer(layer); // Adding layer to the map

         map.on("click", function(e){
            new L.Marker([e.latlng.lat, e.latlng.lng]).addTo(map);
         })
      </script>
   </body>

</html>
它生成以下輸出:
LeafletJS - 疊加層
除了地圖疊加層之外,您還可以使用影像、影片疊加層在Leaflet應用程式中。在本章中,我們將瞭解如何使用此類疊加層。
影像疊加層
請按照以下步驟使用影像疊加層。
步驟 1 - 透過傳遞 <div> 元素(字串或物件)和地圖選項(可選)來建立 Map 物件。
步驟 2 - 透過傳遞所需瓦片的 URL 來建立 Layer 物件。
步驟 3 - 使用 Map 類的 addLayer() 方法將圖層物件新增到地圖。
步驟 4 − 使用L.imageOverlay()建立影像疊加層。傳遞影像的URL和一個表示影像邊界的物件,如下所示。
// Creating Image overlay
var imageUrl = 'tpPoster.jpg';
var imageBounds = [[17.342761, 78.552432], [16.396553, 80.727725]];
var overlay = L.imageOverlay(imageUrl, imageBounds);
步驟 5 − 使用imageOverlay類的addTo()方法將疊加層新增到地圖上,如下所示。
// Adding overlay to the map
overlay.addTo(map);
示例
以下程式碼演示了影像疊加層的使用。
<!DOCTYPE html>
<html>
   <head>
      <title>Image Overlay Example</title>
      <link rel = "stylesheet" href = "http://cdn.leafletjs.com/leaflet-0.7.3/leaflet.css"/>
      <script src = "http://cdn.leafletjs.com/leaflet-0.7.3/leaflet.js"></script>
   </head>

   <body>
      <div id = "map" style = "width:900px; height:580px"></div>
      <script>
         // Creating map options
         var mapOptions = {
            center: [17.342761, 78.552432],
            zoom: 8
         }
         var map = new L.map('map', mapOptions); // Creating a map object

         // Creating a Layer object
         var layer = new L.TileLayer('http://{s}.tile.openstreetmap.org/{z}/{x}/{y}.png');
         map.addLayer(layer);  // Adding layer to the map

         // Creating Image overlay
         var imageUrl = 'tpPoster.jpg';
         var imageBounds = [[17.342761, 78.552432], [16.396553, 80.727725]];
         var overlay = L.imageOverlay(imageUrl, imageBounds);
         overlay.addTo(map);
      </script>
   </body>

</html>
它生成以下輸出:

LeafletJS - 控制元件
Leaflet提供了各種控制元件,例如縮放、署名、比例尺等,其中:−
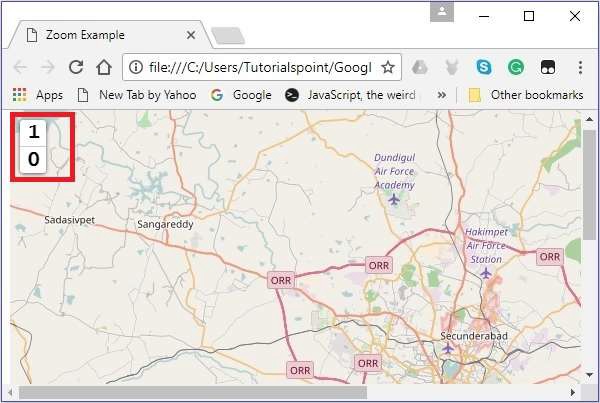
縮放 − 預設情況下,此控制元件位於地圖的左上角。它有兩個按鈕"+"和"–",您可以使用它們放大或縮小地圖。您可以透過將地圖選項的zoomControl選項設定為false來移除預設的縮放控制元件。
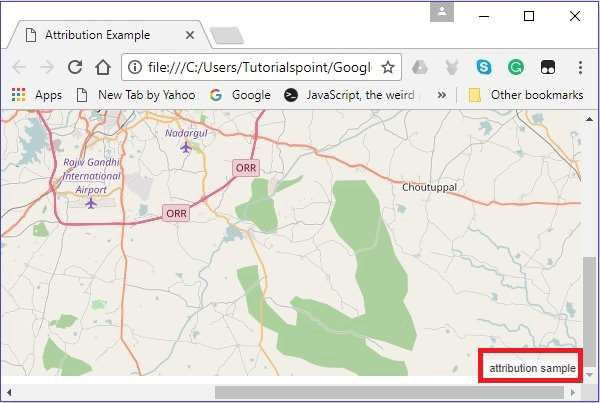
署名 − 預設情況下,此控制元件位於地圖的右下角。它在一個小文字框中顯示署名資料。預設情況下,它顯示文字。您可以透過將地圖選項的attributionControl選項設定為false來移除預設的署名控制元件。
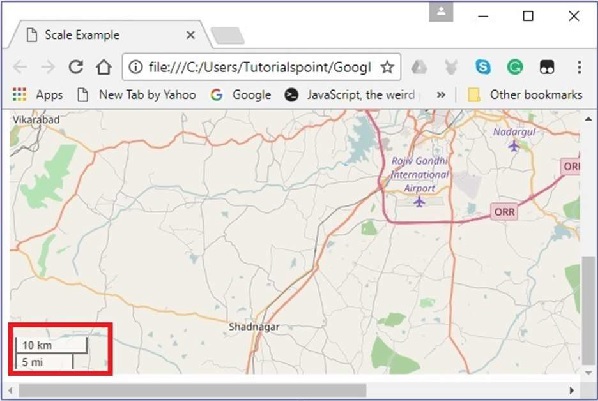
比例尺 − 預設情況下,此控制元件位於地圖的左下角。它顯示螢幕當前的中心點。
在本章中,我們將解釋如何使用Leaflet JavaScript庫建立並將所有這三個控制元件新增到您的地圖中。
縮放
要使用Leaflet JavaScript庫將您自己的縮放控制元件新增到地圖中,請按照以下步驟操作:−
步驟 1 − 透過傳遞元素(字串或物件)和地圖選項(可選)來建立一個Map物件。
步驟 2 - 透過傳遞所需瓦片的 URL 來建立 Layer 物件。
步驟 3 - 使用 Map 類的 addLayer() 方法將圖層物件新增到地圖。
步驟 4 − 建立zoomOptions變數,併為放大和縮小選項定義您自己的文字值,而不是預設值(+和-)。
然後,透過將zoomOptions變數傳遞給L.control.zoom()來建立縮放控制元件,如下所示。
// zoom control options
var zoomOptions = {
   zoomInText: '1',
   zoomOutText: '0',
};
// Creating zoom control
var zoom = L.control.zoom(zoomOptions);
步驟 5 − 使用addTo()方法將上一步建立的縮放控制元件物件新增到地圖上。
// Adding zoom control to the map
zoom.addTo(map);
示例
以下是將您自己的縮放控制元件新增到地圖上(而不是預設控制元件)的程式碼。在這裡,按下1時,地圖放大,按下0時,地圖縮小。
<!DOCTYPE html>
<html>
   <head>
      <title>Zoom Example</title>
      <link rel = "stylesheet" href = "http://cdn.leafletjs.com/leaflet-0.7.3/leaflet.css"/>
      <script src = "http://cdn.leafletjs.com/leaflet-0.7.3/leaflet.js"></script>
   </head>

   <body>
      <div id = "map" style = "width:900px; height:580px"></div>
      <script>
         // Creating map options
         var mapOptions = {
            center: [17.385044, 78.486671],
            zoom: 10,
            zoomControl: false
         }
         var map = new L.map('map', mapOptions); // Creating a map object

         // Creating a Layer object
         var layer = new L.TileLayer('http://{s}.tile.openstreetmap.org/{z}/{x}/{y}.png');
         map.addLayer(layer);   // Adding layer to the map

         // zoom control options
         var zoomOptions = {
            zoomInText: '1',
            zoomOutText: '0',
         };
         var zoom = L.control.zoom(zoomOptions);   // Creating zoom control
         zoom.addTo(map);   // Adding zoom control to the map
      </script>
   </body>

</html>
它生成以下輸出:
署名
要使用Leaflet JavaScript庫將您自己的署名新增到地圖中,請按照以下步驟操作:−
步驟 1 - 透過傳遞 <div> 元素(字串或物件)和地圖選項(可選)來建立 Map 物件。
步驟 2 - 透過傳遞所需瓦片的 URL 來建立 Layer 物件。
步驟 3 - 使用 Map 類的 addLayer() 方法將圖層物件新增到地圖。
步驟 4 − 建立attrOptions變數,並定義您自己的字首值,而不是預設值(leaflet)。
然後,透過將attrOptions變數傳遞給L.control.attribution()來建立署名控制元件,如下所示。
// Attribution options
var attrOptions = {
   prefix: 'attribution sample'
};

// Creating an attribution
var attr = L.control.attribution(attrOptions);
步驟 5 − 使用addTo()方法將上一步建立的署名控制元件物件新增到地圖上。
// Adding attribution to the map
attr.addTo(map);
示例
以下程式碼將我們自己的署名控制元件新增到您的地圖上(而不是預設控制元件)。在這裡,將顯示文字署名示例。
<!DOCTYPE html>
<html>
   <head>
      <title>Attribution Example</title>
      <link rel = "stylesheet" href = "http://cdn.leafletjs.com/leaflet-0.7.3/leaflet.css"/>
      <script src = "http://cdn.leafletjs.com/leaflet-0.7.3/leaflet.js"></script>
   </head>

   <body>
      <div id = "map" style = "width: 900px; height: 580px"></div>
      <script>
         // Creating map options
         var mapOptions = {
            center: [17.385044, 78.486671],
            zoom: 10,
            attributionControl: false
         }
         var map = new L.map('map', mapOptions); // Creating a map object

         // Creating a Layer object
         var layer = new L.TileLayer('http://{s}.tile.openstreetmap.org/{z}/{x}/{y}.png');
         map.addLayer(layer);    // Adding layer to the map

         // Attribution options
         var attrOptions = {
            prefix: 'attribution sample'
         };

         // Creating an attribution
         var attr = L.control.attribution(attrOptions);
         attr.addTo(map);  // Adding attribution to the map
      </script>
   </body>

</html>>
它生成以下輸出:
比例尺
要使用Leaflet JavaScript庫將您自己的比例尺控制元件新增到地圖中,請按照以下步驟操作:−
步驟 1 - 透過傳遞 <div> 元素(字串或物件)和地圖選項(可選)來建立 Map 物件。
步驟 2 - 透過傳遞所需瓦片的 URL 來建立 Layer 物件。
步驟 3 − 使用Map類的addLayer()方法將layer物件新增到地圖上。
步驟 4 − 透過傳遞L.control.scale()來建立比例尺控制元件,如下所示。
// Creating scale control
var scale = L.control.scale();
步驟 5 − 使用addTo()方法將上一步建立的比例尺控制元件物件新增到地圖上,如下所示。
// Adding scale control to the map
scale.addTo(map);
示例
以下程式碼將比例尺控制元件新增到您的地圖上。
<!DOCTYPE html>
<html>
   <head>
      <title>Scale Example</title>
      <link rel = "stylesheet" href = "http://cdn.leafletjs.com/leaflet-0.7.3/leaflet.css" />
      <script src = "http://cdn.leafletjs.com/leaflet-0.7.3/leaflet.js"></script>
   </head>

   <body>
      <div id = "map" style = "width:900px; height:580px"></div>
      <script>
         // Creating map options
         var mapOptions = {
            center: [17.385044, 78.486671],
            zoom: 10
         }
         // Creating a map object
         var map = new L.map('map', mapOptions);

         // Creating a Layer object
         var layer = new L.TileLayer('http://{s}.tile.openstreetmap.org/{z}/{x}/{y}.png');
         map.addLayer(layer); // Adding layer to the map
         var scale = L.control.scale(); // Creating scale control
         scale.addTo(map); // Adding scale control to the map
      </script>
   </body>

</html>
它生成以下輸出: