- JFreeChart 教程
- JFreeChart - 主頁
- JFreeChart - 概覽
- JFreeChart - 安裝
- JFreeChart - 架構
- JFreeChart - 引用 API
- JFreeChart - 餅圖
- JFreeChart - 條形圖
- JFreeChart - 折線圖
- JFreeChart - XY 圖
- JFreeChart - 三維圖表/條形圖
- JFreeChart - 氣泡圖
- JFreeChart - 時間序列圖
- JFreeChart - 檔案介面
- JFreeChart - 資料庫介面
- JFreeChart 有用資源
- JFreeChart - 快速指南
- JFreeChart - 有用資源
- JFreeChart - 討論
JFreeChart - XY 圖
這 XY 圖(散點)基於一個包含 X 和 Y 值列表的資料序列。每個值對 (X,Y) 都是座標系中的一個點。這裡,一個值確定水平(X)位置,而另一個值確定垂直(Y)位置。本章介紹如何使用 JFreeChart 根據給定的業務資料集建立 **XY 圖**。
商業資料
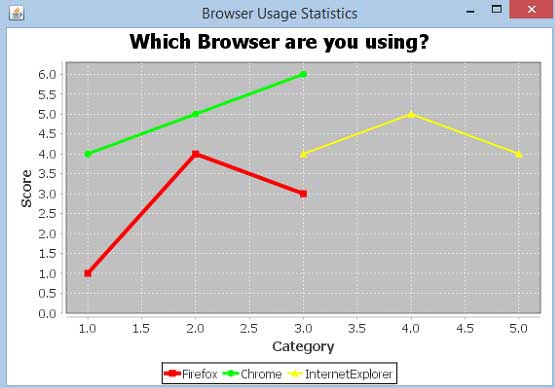
考慮一個示例,其中我們想要為所有主流瀏覽器建立 XY 圖。這裡,不同類別的人員收集不同的效能評分,如下所示 −
| 火狐 | 類別 (X) | 評分 (Y) |
|---|---|---|
| 1.0 | 1.0 | |
| 2.0 | 4.0 | |
| 3.0 | 3.0 | |
| 谷歌瀏覽器 | 類別 (X) | 評分 (Y) |
| 1.0 | 4.0 | |
| 2.0 | 5.0 | |
| 3.0 | 6.0 | |
| IE | 類別 (X) | 評分 (Y) |
| 3.0 | 4.0 | |
| 4.0 | 5.0 | |
| 5.0 | 4.0 |
基於 AWT 的應用程式
以下是根據上述給定資訊建立 XY 圖的程式碼。此程式碼可以幫助你將 XY 圖嵌入任何基於 AWT 的應用程式。
import java.awt.Color;
import java.awt.BasicStroke;

import org.jfree.chart.ChartPanel;
import org.jfree.chart.JFreeChart;
import org.jfree.data.xy.XYDataset;
import org.jfree.data.xy.XYSeries;
import org.jfree.ui.ApplicationFrame;
import org.jfree.ui.RefineryUtilities;
import org.jfree.chart.plot.XYPlot;
import org.jfree.chart.ChartFactory;
import org.jfree.chart.plot.PlotOrientation;
import org.jfree.data.xy.XYSeriesCollection;
import org.jfree.chart.renderer.xy.XYLineAndShapeRenderer;

public class XYLineChart_AWT extends ApplicationFrame {

   public XYLineChart_AWT( String applicationTitle, String chartTitle ) {
      super(applicationTitle);
      JFreeChart xylineChart = ChartFactory.createXYLineChart(
         chartTitle ,
         "Category" ,
         "Score" ,
         createDataset() ,
         PlotOrientation.VERTICAL ,
         true , true , false);

      ChartPanel chartPanel = new ChartPanel( xylineChart );
      chartPanel.setPreferredSize( new java.awt.Dimension( 560 , 367 ) );
      final XYPlot plot = xylineChart.getXYPlot( );

      XYLineAndShapeRenderer renderer = new XYLineAndShapeRenderer( );
      renderer.setSeriesPaint( 0 , Color.RED );
      renderer.setSeriesPaint( 1 , Color.GREEN );
      renderer.setSeriesPaint( 2 , Color.YELLOW );
      renderer.setSeriesStroke( 0 , new BasicStroke( 4.0f ) );
      renderer.setSeriesStroke( 1 , new BasicStroke( 3.0f ) );
      renderer.setSeriesStroke( 2 , new BasicStroke( 2.0f ) );
      plot.setRenderer( renderer );
      setContentPane( chartPanel );
   }

   private XYDataset createDataset( ) {
      final XYSeries firefox = new XYSeries( "Firefox" );
      firefox.add( 1.0 , 1.0 );
      firefox.add( 2.0 , 4.0 );
      firefox.add( 3.0 , 3.0 );

      final XYSeries chrome = new XYSeries( "Chrome" );
      chrome.add( 1.0 , 4.0 );
      chrome.add( 2.0 , 5.0 );
      chrome.add( 3.0 , 6.0 );

      final XYSeries iexplorer = new XYSeries( "InternetExplorer" );
      iexplorer.add( 3.0 , 4.0 );
      iexplorer.add( 4.0 , 5.0 );
      iexplorer.add( 5.0 , 4.0 );

      final XYSeriesCollection dataset = new XYSeriesCollection( );
      dataset.addSeries( firefox );
      dataset.addSeries( chrome );
      dataset.addSeries( iexplorer );
      return dataset;
   }

   public static void main( String[ ] args ) {
      XYLineChart_AWT chart = new XYLineChart_AWT("Browser Usage Statistics",
         "Which Browser are you using?");
      chart.pack( );
      RefineryUtilities.centerFrameOnScreen( chart );
      chart.setVisible( true );
   }
}
讓我們將上述 Java 程式碼保留在 **XYLineChart_AWT.java** 檔案中,然後從命令提示符中編譯並執行它,方法如下
$javac XYLineChart_AWT.java
$java XYLineChart_AWT
如果一切正常,它將編譯並執行以生成以下 XY 圖 −
JPEG 影像建立
我們重寫上述示例,從命令列生成 JPEG 影像。
import java.io.*;

import org.jfree.chart.ChartFactory;
import org.jfree.chart.JFreeChart;
import org.jfree.data.xy.XYSeries;
import org.jfree.chart.plot.PlotOrientation;
import org.jfree.data.xy.XYSeriesCollection;
import org.jfree.chart.ChartUtilities;

public class XYLineChart_image {

   public static void main( String[ ] args )throws Exception {
      final XYSeries firefox = new XYSeries( "Firefox" );
      firefox.add( 1.0 , 1.0 );
      firefox.add( 2.0 , 4.0 );
      firefox.add( 3.0 , 3.0 );

      final XYSeries chrome = new XYSeries( "Chrome" );
      chrome.add( 1.0 , 4.0 );
      chrome.add( 2.0 , 5.0 );
      chrome.add( 3.0 , 6.0 );

      final XYSeries iexplorer = new XYSeries( "InternetExplorer" );
      iexplorer.add( 3.0 , 4.0 );
      iexplorer.add( 4.0 , 5.0 );
      iexplorer.add( 5.0 , 4.0 );

      final XYSeriesCollection dataset = new XYSeriesCollection( );
      dataset.addSeries( firefox );
      dataset.addSeries( chrome );
      dataset.addSeries( iexplorer );

      JFreeChart xylineChart = ChartFactory.createXYLineChart(
         "Browser usage statastics",
         "Category",
         "Score",
         dataset,
         PlotOrientation.VERTICAL,
         true, true, false);

      int width = 640;   /* Width of the image */
      int height = 480;  /* Height of the image */
      File XYChart = new File( "XYLineChart.jpeg" );
      ChartUtilities.saveChartAsJPEG( XYChart, xylineChart, width, height);
   }
}
讓我們將上述 Java 程式碼保留在 **XYLineChart_image.java** 檔案中,然後從命令提示符中編譯並執行它,方法如下 −
$javac XYLineChart_image.java
$java XYLineChart_image
如果一切正常,它將編譯並執行,在當前目錄中建立一個名為 **XYLineChart.jpeg** 的 JPEG 影像檔案。
廣告