
 資料結構
資料結構 網路
網路 RDBMS
RDBMS 作業系統
作業系統 Java
Java iOS
iOS HTML
HTML CSS
CSS Android
 Python
 C 程式設計
 C++
C++ C#
C# MongoDB
 MySQL
MySQL Javascript
 PHP
PHP如何設定Matplotlib 中的 NetworkX 邊緣標籤偏移量?
要設定 networkx 邊緣標籤偏移量,我們可以採取以下步驟 -
- 設定圖形大小並調整子圖之間和周圍的邊距。
- 初始化帶有邊緣、名稱或圖形屬性的圖形。
- 新增多個節點。
- 使用 add_edge_from() 方法新增所有邊緣。
- 使用 Fruchterman-Reingold 力導向演算法定位節點。
- 用 Matplotlib 繪製圖形 G。
- 繪製邊緣標籤。
- 要顯示圖形,請使用 show() 方法。
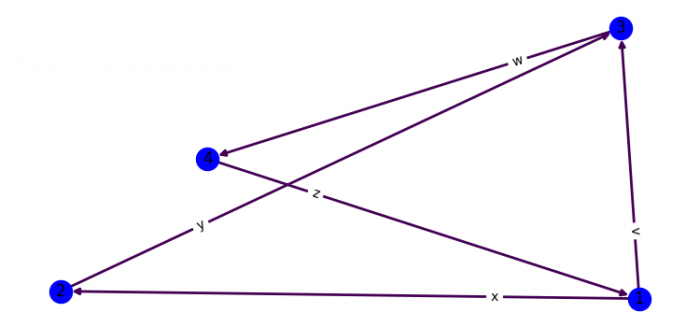
示例
import matplotlib.pylab as plt
import networkx as nx

plt.rcParams["figure.figsize"] = [7.50, 3.50]
plt.rcParams["figure.autolayout"] = True

G = nx.DiGraph()

G.add_nodes_from([1, 2, 3, 4])
G.add_edges_from([(1, 2), (2, 3), (3, 4), (4, 1), (1, 3)])

pos = nx.spring_layout(G)

for u, v, d in G.edges(data=True):
   d['weight'] = 3

edges, weights = zip(*nx.get_edge_attributes(G, 'weight').items())

nx.draw(G, pos, node_color='b', edge_color=weights, width=2, with_labels=True)

nx.draw_networkx_edge_labels(
   G, pos,
   {(1, 2): "x", (2, 3): "y", (3, 4): "w",
      (4, 1): "z", (1, 3): "v"}, label_pos=0.75
)
plt.show()
輸出

更新於: 10-6-2021
1000+ 次瀏覽

廣告