
 資料結構
資料結構 網路
網路 RDBMS
RDBMS 作業系統
作業系統 Java
Java iOS
iOS HTML
HTML CSS
CSS Android
 Python
 C 程式設計
 C++
C++ C#
C# MongoDB
 MySQL
MySQL Javascript
 PHP
PHP如何在 matplotlib.hlines 中設定標籤?
要在 matplotlib.hlines 中設定標籤,我們可以採取以下步驟 -
- 設定圖形大小並調整子圖之間和周圍的填充。
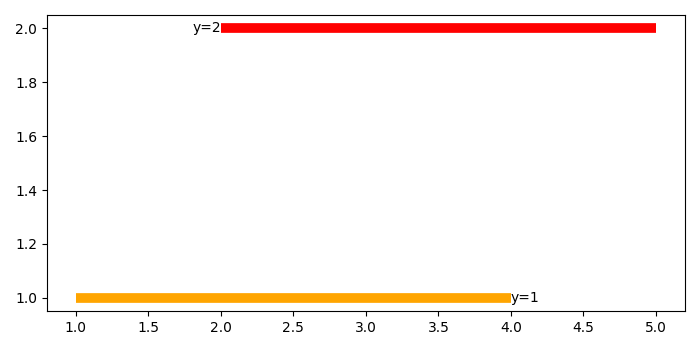
- 在軸線上新增一條水平線,y=1,帶 y=1 標籤,顏色='橙色'。
- 在軸線上新增一條水平線,y=2,帶 y=2 標籤,顏色='紅色'。
- 要顯示圖形,請使用 show() 方法。
示例
import matplotlib.pyplot as plt

# Set the figure size
plt.rcParams["figure.figsize"] = [7.00, 3.50]
plt.rcParams["figure.autolayout"] = True

# Add horizontal line
plt.hlines(y=1, xmin=1, xmax=4, lw=7, color='orange')
plt.text(4, 1, 'y=1', ha='left', va='center')

# Add another horizontal line
plt.hlines(y=2, xmin=2, xmax=5, lw=7, color='red')
plt.text(2, 2, 'y=2', ha='right', va='center')

plt.show()
輸出
將產生以下輸出


更新於: 2021 年 9 月 19 日
4K+ 次瀏覽

廣告