
 資料結構
資料結構 網路
網路 RDBMS
RDBMS 作業系統
作業系統 Java
Java iOS
iOS HTML
HTML CSS
CSS Android
 Python
 C 程式設計
 C++
C++ C#
C# MongoDB
 MySQL
MySQL Javascript
 PHP
PHP如何在 Matplotlib 中更改刻度標籤和軸標籤之間的間距?
要在 Matplotlib 中更改刻度標籤和軸標籤之間的間距,我們可以在 xlabel() 方法中使用 labelpad。
步驟
- 設定圖形大小並調整子圖之間和周圍的內間距。
- 使用 plot() 方法繪製列表的資料點。
- 在座標軸上設定刻度。
- 將 X 和 Y 座標軸邊距設定為 0。
- 使用 labelpad 設定 X 座標軸標籤。
- 要顯示圖形,請使用 show() 方法。
示例
from matplotlib import pyplot as plt
plt.rcParams["figure.figsize"] = [7.50, 3.50]
plt.rcParams["figure.autolayout"] = True
plt.plot([1, 2, 3, 4, 5])
plt.xticks([1, 2, 3, 4, 5])
plt.margins(x=0, y=0)
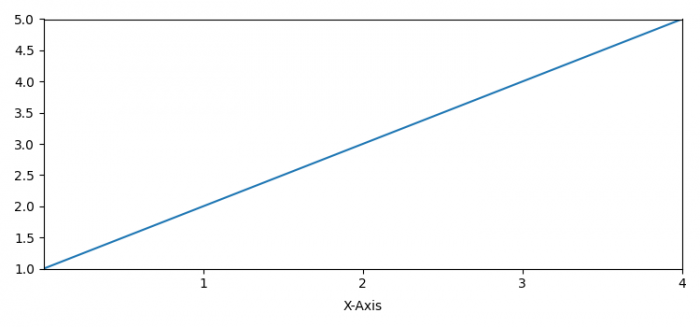
plt.xlabel("X-axis", labelpad=7)
plt.show()輸出

更新於: 2021 年 6 月 17 日
20K+ 瀏覽量

廣告