
 資料結構
資料結構 網路
網路 RDBMS
RDBMS 作業系統
作業系統 Java
Java iOS
iOS HTML
HTML CSS
CSS 安卓
安卓 Python
 C 程式設計
 C++
C++ C#
C# MongoDB
 MySQL
MySQL JavaScript
 PHP
PHP如何在 Python Matplotlib 中繪製多變數函式?
要在 Python 中繪製多變數函式,我們可以執行以下步驟 -
步驟
設定圖片大小並調整子圖之間的填充間距。
使用 numpy 建立隨機的x、y和z資料點。
建立圖片和一組子圖。
使用x、y和z資料點建立散點圖。
為 ScalarMappable 例項建立一個顏色條,s。
要顯示圖片,請使用show()方法。
示例
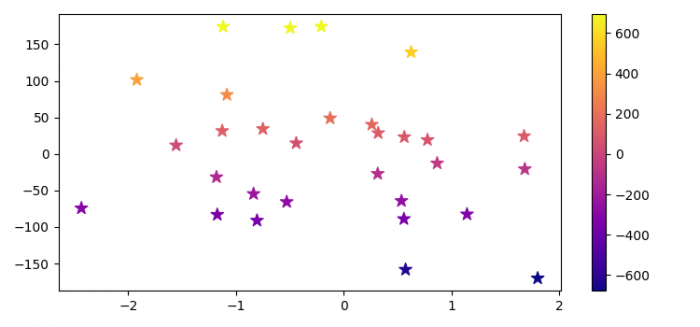
import numpy as np
import matplotlib.pyplot as plt

plt.rcParams["figure.figsize"] = [7.50, 3.50]
plt.rcParams["figure.autolayout"] = True

def func(x, y):
   return 3 * x + 4 * y - 2 + np.random.randn(30)

x, y = np.random.randn(2, 30)
y *= 100
z = func(x, y)

fig, ax = plt.subplots()

s = ax.scatter(x, y, c=z, s=100, marker='*', cmap='plasma')

fig.colorbar(s)

plt.show()
輸出
它將生成以下輸出 -

更新於: 2022-02-01
6K+ 檢視次數

廣告