
 資料結構
資料結構 網路
網路 RDBMS
RDBMS 作業系統
作業系統 Java
Java iOS
iOS HTML
HTML CSS
CSS Android
 Python
 C 程式設計
 C++
C++ C#
C# MongoDB
 MySQL
MySQL Javascript
 PHP
PHP如何在 Matplotlib 中使用 FuncAnimation 繪製指數衰減函式
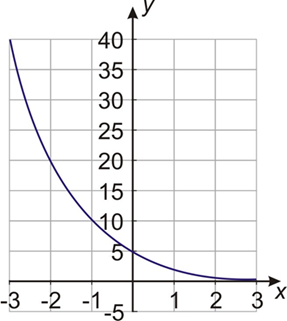
我們假設我們想以指數衰減的方式動態顯示一個函式,如 y = a(b)^x,其中 b = 增長因子且 a = 初始值。
一個指數衰減函式看起來像這樣:
不過,現在我們想動態顯示並繪製指數衰減的正切函式。
首先匯入庫:
import numpy as np
import matplotlib.pyplot as plt
from matplotlib.animation import FuncAnimation
定義座標軸:
fig, a = plt.subplots()
繪製帶有座標軸的空白圖形:
xdata, ydata = [], []
line, = ax.plot(xdata, ydata)
設定網格線的限制:
ax.set_xlim(0, 10)
ax.set_ylim(-3.0, 3.0)
ax.grid()
定義函式以生成資料,這些資料將代替幀數:
def frame_generator(i=0):
   while i < 50:
      i += 0.1
      yield x, np.tan(2*np.pi*x) * np.exp(-x/5.)
定義函式以繪製動畫:
def animate(data):
   x, y = data
   xdata.append(x)
   ydata.append(y)
   xmin, xmax = ax.get_xlim()
   if x >= xmax:
      ax.set_xlim(xmin, 2*xmax)
      ax.figure.canvas.draw()
   line.set_data(xdata, ydata)
   return line
啟用動畫:
ani = FuncAnimation(fig, animate, frame_gen, blit=True, interval=2, repeat=False)
繪製圖形:
plt.show()
輸出


更新於: 23-2-2021
211 次瀏覽

廣告