
 資料結構
資料結構 網路
網路 關係型資料庫管理系統
 作業系統
作業系統 Java
Java iOS
iOS HTML
HTML CSS
CSS Android
 Python
 C 程式設計
 C++
C++ C#
C# MongoDB
 MySQL
MySQL Javascript
 PHP
PHP如何使用 JavaFX 建立散點圖?
氣泡圖以一系列資料點 (x, y) 作為輸入值,併為給定系列中的資料點建立符號。在 JavaFX 中,您可以透過例項化javafx.scene.chart.ScatterChart類來建立散點圖。
在例項化此類時,您必須傳遞 Axis 類的兩個物件,分別表示 x 軸和 y 軸(作為建構函式的引數)。由於 Axis 類是抽象類,因此您需要傳遞其具體子類的物件,例如 NumberAxis(用於數值)或 CategoryAxis(用於字串值)。
建立軸後,您可以使用setLabel()方法為其設定標籤。
設定資料
XYChart.Series表示資料項的系列。您可以透過例項化此類來建立符號的一系列點。此類包含一個可觀察列表,其中包含系列中的所有點。
XYChart.Data表示 x-y 平面中的特定資料點。要建立點,您需要透過傳遞該點的 x 和 y 值來例項化此類。
因此,要為符號建立資料 -
透過例項化XYChart.Data類建立所需數量的點。
透過例項化XYChart.Series類建立系列。
使用getData()方法獲取 XYChart.Series 類的可觀察列表。
使用add()或addAll()方法將建立的資料點新增到列表中。
將建立的資料系列新增到區域圖中,如下所示 -
scatterChart.getData().add(series);
示例
import javafx.application.Application;
import javafx.scene.Scene;
import javafx.stage.Stage;
import javafx.scene.chart.NumberAxis;
import javafx.scene.chart.ScatterChart;
import javafx.scene.chart.XYChart;
import javafx.scene.layout.StackPane;
public class ScatterChartExample extends Application {
public void start(Stage stage) {
//Creating the X and Y axes
NumberAxis xAxis = new NumberAxis(10, 26, 2);
NumberAxis yAxis = new NumberAxis(0, 700, 100);
//Setting labels to the axes
xAxis.setLabel("Temperature °C");
yAxis.setLabel("Ice Cream Sales in (USD)");
//Creating the Scatter chart
ScatterChart scatterChart = new ScatterChart(xAxis, yAxis);
//Preparing data for the scatter chart
XYChart.Series series = new XYChart.Series();
series.getData().add(new XYChart.Data(14.2, 215));
series.getData().add(new XYChart.Data(16.4, 325));
series.getData().add(new XYChart.Data(11.9, 185));
series.getData().add(new XYChart.Data(15.2, 332));
series.getData().add(new XYChart.Data(18.5, 406));
series.getData().add(new XYChart.Data(22.1, 522));
series.getData().add(new XYChart.Data(19.4, 412));
series.getData().add(new XYChart.Data(25.1, 614));
series.getData().add(new XYChart.Data(23.4, 544));
series.getData().add(new XYChart.Data(18.1, 421));
series.getData().add(new XYChart.Data(22.6, 445));
series.getData().add(new XYChart.Data(17.2, 408));
//Setting the data to scatter chart
scatterChart.getData().addAll(series);
//Setting title to the scatter chart
//Setting name to the series
series.setName("Temperatue vs Icecream Sales");
//Creating a stack pane to hold the chart
StackPane pane = new StackPane(scatterChart);
//Setting the Scene
Scene scene = new Scene(pane, 595, 350);
stage.setTitle("Scatter Chart");
stage.setScene(scene);
stage.show();
}
public static void main(String args[]){
launch(args);
}
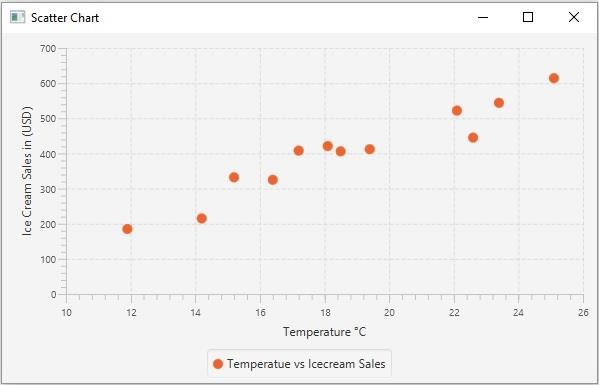
}輸出

更新於: 2020-05-19
238 次瀏覽

廣告