
 資料結構
資料結構 網路
網路 RDBMS
RDBMS 作業系統
作業系統 Java
Java iOS
iOS HTML
HTML CSS
CSS Android
 Python
 C 程式設計
 C++
C++ C#
C# MongoDB
 MySQL
MySQL Javascript
 PHP
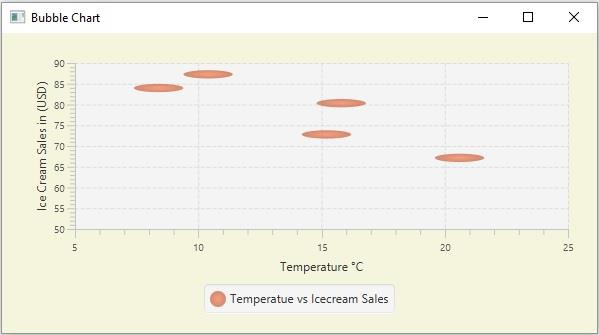
PHP如何在 JavaFX 中用兩個引數建立氣泡圖?
氣泡圖接受一系列資料點 (x, y) 作為輸入值,並針對給定序列中的資料點建立氣泡。在 JavaFX 中,你可以透過例項化 javafx.scene.chart.BubbleChart 類來建立一個氣泡圖。
通常,在所有 X-Y 圖表中,資料點表示兩個值 (x, y)。氣泡圖中有一個第三個值,即半徑。此圖在三維中繪製資料點時非常方便。
無論如何,擁有第三個值並不是必要的,它只是可選的。與任何其他 XY 影像一樣,你可以建立具有兩個值的氣泡圖。
示例
以下是 JavaFX 示例,演示如何建立具有兩個值的氣泡圖 −
import javafx.application.Application;
import javafx.geometry.Insets;
import javafx.scene.Scene;
import javafx.stage.Stage;
import javafx.scene.chart.BubbleChart;
import javafx.scene.chart.NumberAxis;
import javafx.scene.chart.XYChart;
import javafx.scene.layout.StackPane;
public class BubbleChart_TwoParams extends Application {
   public void start(Stage stage) {
      //Creating the X and Y axes
      NumberAxis xAxis = new NumberAxis(5, 25, 5);
      NumberAxis yAxis = new NumberAxis(50, 90, 5);
      //Setting labels to the axes
      xAxis.setLabel("Temperature °C");
      yAxis.setLabel("Ice Cream Sales in (USD)");
      //Creating the Scatter chart
      BubbleChart bubbleChart = new BubbleChart(xAxis, yAxis);
      //Preparing data for the scatter chart
      XYChart.Series series = new XYChart.Series();
      series.getData().add(new XYChart.Data(15.2, 72.79));
      series.getData().add(new XYChart.Data(8.39, 83.97));
      series.getData().add(new XYChart.Data(20.6, 67.14));
      series.getData().add(new XYChart.Data(15.8, 80.32));
      series.getData().add(new XYChart.Data(10.4, 87.27));
      //Setting the data to scatter chart
      bubbleChart.getData().add(series);
      //Setting title to the scatter chart
      //scatterChart.setTitle("Ice Cream Sales vs Temperature");
      //Setting name to the series
      series.setName("Temperatue vs Icecream Sales");
      //Creating a stack pane to hold the chart
      StackPane pane = new StackPane(bubbleChart);
      pane.setPadding(new Insets(15, 15, 15, 15));
      pane.setStyle("-fx-background-color: BEIGE");
      //Setting the Scene
      Scene scene = new Scene(pane, 595, 300);
      stage.setTitle("Bubble Chart");
      stage.setScene(scene);
      stage.show();
   }
   public static void main(String args[]){
      launch(args);
   }
}
輸出

更新於:2020 年 5 月 20 日
100 次瀏覽

廣告