
 資料結構
資料結構 網路
網路 關係型資料庫管理系統
 作業系統
作業系統 Java
Java iOS
iOS HTML
HTML CSS
CSS Android
 Python
 C 程式設計
 C++
C++ C#
C# MongoDB
 MySQL
MySQL Javascript
 PHP
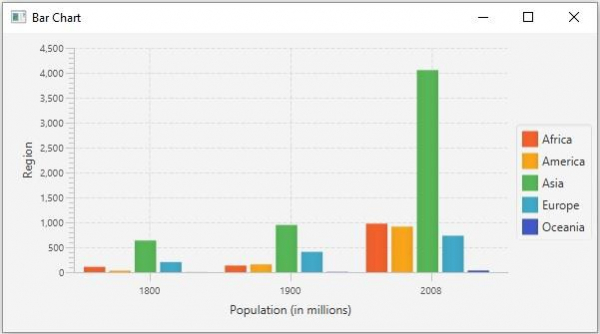
PHP如何使用 JavaFX 建立條形圖?
條形圖以一系列資料點 (x, y) 作為輸入值,並建立表示其值的條形。通常,這些圖表用於表示類別的值。根據類別的軸,條形圖的條形可以是垂直的或水平的。在 JavaFX 中,您可以透過例項化 **javafx.scene.chart.BarChart** 類來建立條形圖。
在例項化此類時,您必須傳遞 Axis 類的兩個物件,分別表示 x 軸和 y 軸(作為建構函式的引數)。由於 Axis 類是抽象類,因此您需要傳遞其具體子類的物件,例如 NumberAxis(用於數值)或 CategoryAxis(用於字串值)。
建立軸後,您可以使用 **setLabel()** 方法為其設定標籤。
設定資料
**XYChart.Series** 表示資料項的系列。您可以透過例項化此類來建立條形的一系列點。此類包含一個可觀察列表,其中包含系列中的所有點。
**XYChart.Data** 表示 x-y 平面中的特定資料點。要建立點,您需要透過傳遞該點的 x 和 y 值來例項化此類。
因此,要建立條形資料 -
透過例項化 **XYChart.Data** 類建立所需數量的點。
透過例項化 **XYChart.Series** 類建立系列。
使用 **getData()** 方法獲取 XYChart.Series 類的可觀察列表。
使用 **add()** 或 **addAll()** 方法將建立的資料點新增到列表中。
將建立的資料系列新增到區域圖中,如下所示 -
barChart.getData().add(series);
示例
import javafx.application.Application;
import javafx.geometry.Side;
import javafx.scene.Scene;
import javafx.scene.chart.BarChart;
import javafx.scene.chart.CategoryAxis;
import javafx.stage.Stage;
import javafx.scene.chart.NumberAxis;
import javafx.scene.chart.XYChart;
import javafx.scene.layout.StackPane;
public class BarChartExample extends Application {
   public void start(Stage stage) {
      //Creating X and Y axes
      CategoryAxis xAxis = new CategoryAxis();
      NumberAxis yAxis = new NumberAxis();
      //Adding labels for the axes
      yAxis.setLabel("Region");
      xAxis.setLabel("Population (in millions)");
      //Creating a Bar chart
      BarChart barChart = new BarChart<>(xAxis, yAxis);
      //Preparing data for the bar chart
      XYChart.Series series1 = new XYChart.Series();
      series1.setName("Africa");
      series1.getData().add(new XYChart.Data("1800", 107));
      series1.getData().add(new XYChart.Data("1900", 133));
      series1.getData().add(new XYChart.Data("2008", 973));
      XYChart.Series series2 = new XYChart.Series();
      series2.setName("America");
      series2.getData().add(new XYChart.Data("1800", 31));
      series2.getData().add(new XYChart.Data("1900", 156));
      series2.getData().add(new XYChart.Data("2008", 914));
      XYChart.Series series3 = new XYChart.Series();
      series3.setName("Asia");
      series3.getData().add(new XYChart.Data("1800", 635));
      series3.getData().add(new XYChart.Data("1900", 947));
      series3.getData().add(new XYChart.Data("2008", 4054));
      XYChart.Series series4 = new XYChart.Series();
      series4.setName("Europe");
      series4.getData().add(new XYChart.Data("1800", 203));
      series4.getData().add(new XYChart.Data("1900", 408));
      series4.getData().add(new XYChart.Data("2008", 732));
      XYChart.Series series5 = new XYChart.Series();
      series5.setName("Oceania");
      series5.getData().add(new XYChart.Data("1800", 2));
      series5.getData().add(new XYChart.Data("1900", 6));
      series5.getData().add(new XYChart.Data("2008", 34));
      //Setting the data to bar chart
      barChart.getData().addAll(series1, series2, series3, series4, series5);
      //Setting the legend on the top
      barChart.setLegendSide(Side.RIGHT);
      //Creating a stack pane to hold the chart
      StackPane pane = new StackPane(barChart);
      //Setting the Scene
      Scene scene = new Scene(pane, 595, 300);
      stage.setTitle("Bar Chart");
      stage.setScene(scene);
      stage.show();
   }
   public static void main(String args[]){
      launch(args);
   }
}
輸出

更新時間: 2020-05-19
485 次瀏覽

廣告