
 資料結構
資料結構 網路
網路 RDBMS
RDBMS 作業系統
作業系統 Java
Java iOS
iOS HTML
HTML CSS
CSS Android
 Python
 C 程式設計
 C++
C++ C#
C# MongoDB
 MySQL
MySQL Javascript
 PHP
PHP如何使用 R 中的 ggplot2 為單個向量建立一個條形圖?
若要使用 R 中的 ggplot2 為單個向量建立條形圖,我們可以遵循以下步驟 -
- 首先,建立一個向量並使用 reshape2 包的 melt 函式熔化它,然後儲存熔化後的資料。
- 然後,使用 ggplot2 利用熔化後的資料建立條形圖。
建立向量並熔化它
建立向量並使用 reshape2 的 melt 函式熔化向量中的資料 -
x<-rpois(10,5)
library(reshape2)
x_melted<-melt(x)
x_melted
執行上述指令碼後,會生成以下輸出(由於隨機化導致,此輸出在你自己的系統上可能會不同)-
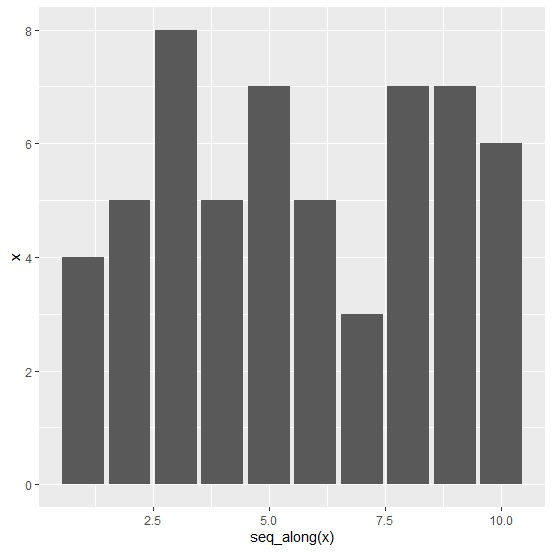
value
1 4
2 5
3 8
4 5
5 7
6 5
7 3
8 7
9 7
10 6
建立條形圖
使用熔化後的資料建立條形圖並使用 seq_along 函式顯示 X 軸值 -
x<-rpois(10,5)
library(reshape2)
x_melted<-melt(x)
library(ggplot2)
ggplot(x_melted,aes(x=seq_along(x),y=x))+geom_bar(stat="identity")
輸出

更新於: 13-Aug-2021
584 次檢視

廣告