如何在 R 中使用 ggplot2 建立水平條形圖,並在條形圖內部尾部新增標籤?
要使用 ggplot2 包建立水平條形圖,我們需要使用 coord_flip() 函式以及 geom_bar,並使用 geom_text 函式新增標籤。ggplot2 的這兩個函式提供了足夠的審美特徵來建立水平條形圖,並將標籤放在條形圖內部末尾。
示例
x<-c("A","B","C","D")
freq<-c(24,26,27,23)
df<-data.frame(x,freq)
df
輸出
x freq
1 A 24
2 B 26
3 C 27
4 D 23
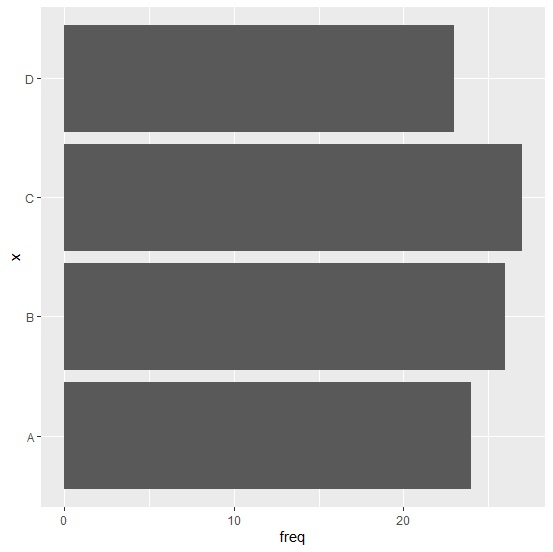
library(ggplot2) ggplot(df,aes(x,freq))+geom_bar(stat="identity")+coord_flip()
輸出

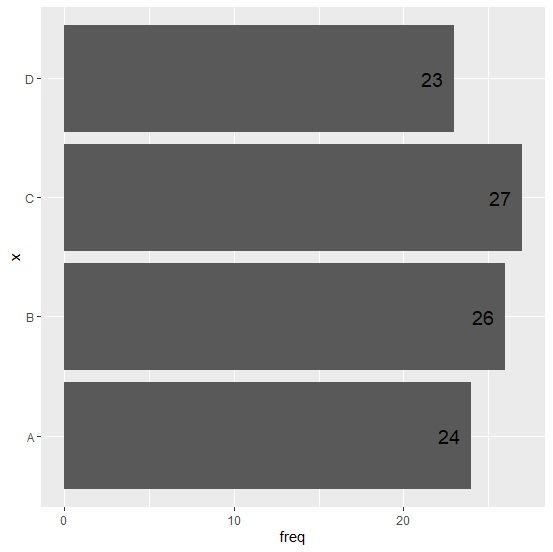
> ggplot(df,aes(x,freq,label=freq))+geom_bar(stat="identity")+geom_text(size=5,hjust=1.5)+coord_flip()
輸出

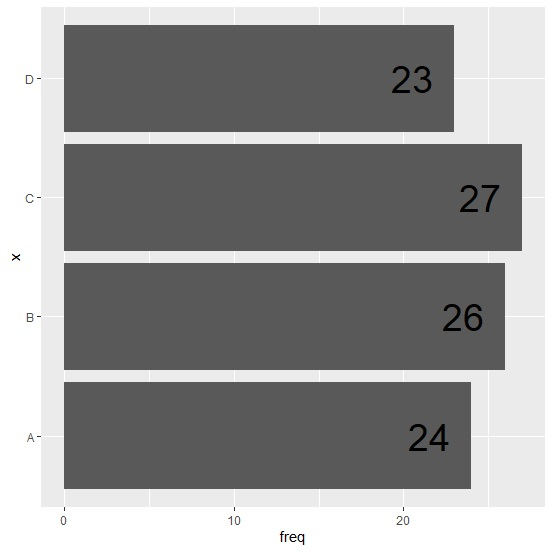
> ggplot(df,aes(x,freq,label=freq))+geom_bar(stat="identity")+geom_text(size=10,hjust=1.5)+coord_flip()
輸出


廣告內容

 資料結構
資料結構 網路
網路 RDBMS
RDBMS 作業系統
作業系統 Java
Java iOS
iOS HTML
HTML CSS
CSS Android
 Python
 C 程式設計
 C++
C++ C#
C# MongoDB
 MySQL
MySQL Javascript
 PHP
PHP