- GWT Google 圖表教程
- GWT Google 圖表 - 主頁
- GWT Google 圖表 - 概覽
- 環境設定
- 配置語法
- GWT Google 圖表 - 區域圖
- GWT Google 圖表 - 柱狀圖
- GWT Google 圖表 - 氣泡圖
- GWT Google 圖表 - 蠟燭圖
- GWT Google 圖表 - 柱圖
- GWT Google 圖表 - 組合圖
- GWT Google 圖表 - 直方圖
- GWT Google 圖表 - 線性圖
- GWT Google 圖表 - 地圖
- GWT Google 圖表 - 組織
- GWT Google 圖表 - 餅圖
- GWT Google 圖表 - Sankey 圖
- GWT Google 圖表 - 散點圖
- GWT Google 圖表 - 階梯區域
- GWT Google 圖表 - 表格圖
- GWT Google 圖表 - 樹形圖
- GWT Google 圖表資源
- GWT Google 圖表 - 快速指南
- GWT Google 圖表 - 資源
- GWT Google 圖表 - 討論
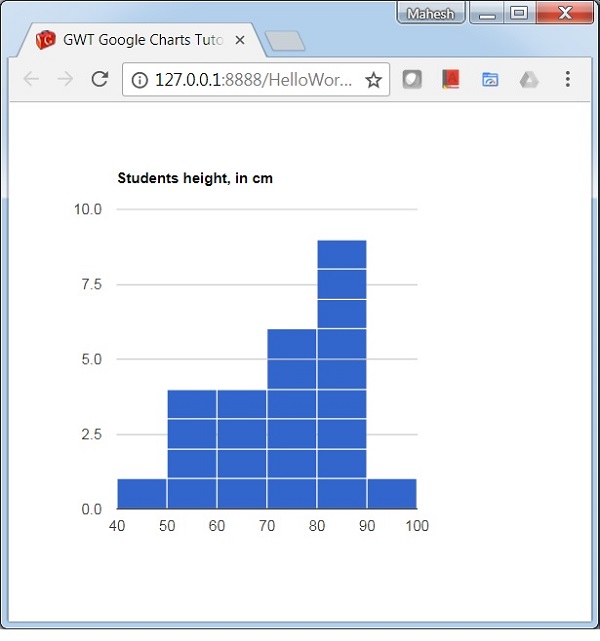
GWT Google 圖表 - 基本直方圖
以下是一個基本直方圖圖表示例。
我們已經在 Google 圖表配置語法 章節中看到了用於繪製圖表的配置。現在,讓我們看一個基本直方圖圖表的示例。
配置
我們使用了 Histogram 類來顯示直方圖圖表。
// Histogram chart
Histogram chart = new Histogram();
示例
HelloWorld.java
package com.tutorialspoint.client;

import com.google.gwt.core.client.EntryPoint;
import com.google.gwt.user.client.ui.RootPanel;

import com.googlecode.gwt.charts.client.ChartLoader;
import com.googlecode.gwt.charts.client.ChartPackage;
import com.googlecode.gwt.charts.client.DataTable;
import com.googlecode.gwt.charts.client.corechart.Histogram;
import com.googlecode.gwt.charts.client.corechart.HistogramOptions;
import com.googlecode.gwt.charts.client.options.Legend;
import com.googlecode.gwt.charts.client.options.LegendPosition;
import com.googlecode.gwt.charts.client.util.ChartHelper;

public class HelloWorld implements EntryPoint {
   private Histogram chart;

   private void initialize() {
      ChartLoader chartLoader = new ChartLoader(ChartPackage.CORECHART);
      chartLoader.loadApi(new Runnable() {
         public void run() {
            // Create and attach the chart
            chart = new Histogram();
            RootPanel.get().add(chart);
            draw();
         }
      });
   }
   private void draw() {

      // Prepare the data
      Object[][] data = new Object[][] { { "Student Roll No", "height" },
         {"1", 80},{"2", 55},{"3", 68},{"4", 80},{"5", 54},
         {"6", 70},{"7", 85},{"8", 78},{"9", 70},{"10", 58},
         {"11", 90},{"12", 65},{"13", 88},{"14", 82},{"15", 65},
         {"16", 86},{"17", 45},{"18", 62},{"19", 84},{"20", 75},
         {"21", 82},{"22", 75},{"23", 58},{"24", 70},{"25", 85}
      };

      DataTable dataTable = ChartHelper.arrayToDataTable(data);
      // Set options
      HistogramOptions options = HistogramOptions.create();
      options.setTitle("Students height, in cm");
      options.setLegend(Legend.create(LegendPosition.NONE));

      // Draw the chart
      chart.draw(dataTable,options);
      chart.setWidth("400px");
      chart.setHeight("400px");
   }
   public void onModuleLoad() {
      initialize();
   }
}
結果
驗證結果。
gwt_googlecharts_histogram_charts.htm
廣告