- GWT Google Charts 教程
- GWT Google Charts - 首頁
- GWT Google Charts - 概覽
- 環境設定
- 配置語法
- GWT Google Charts - 面積圖
- GWT Google Charts - 條形圖
- GWT Google Charts - 氣泡圖
- GWT Google Charts - 蠟燭圖
- GWT Google Charts - 柱狀圖
- GWT Google Charts - 組合圖
- GWT Google Charts - 直方圖
- GWT Google Charts - 折線圖
- GWT Google Charts - 地圖
- GWT Google Charts - 結構圖
- GWT Google Charts - 餅狀圖
- GWT Google Charts - 桑基圖
- GWT Google Charts - 散點圖
- GWT Google Charts - 階梯式面積圖
- GWT Google Charts - 表格圖
- GWT Google Charts - 樹圖
- GWT Google Charts 資源
- GWT Google Charts - 快速指南
- GWT Google Charts - 資源
- GWT Google Charts - 討論
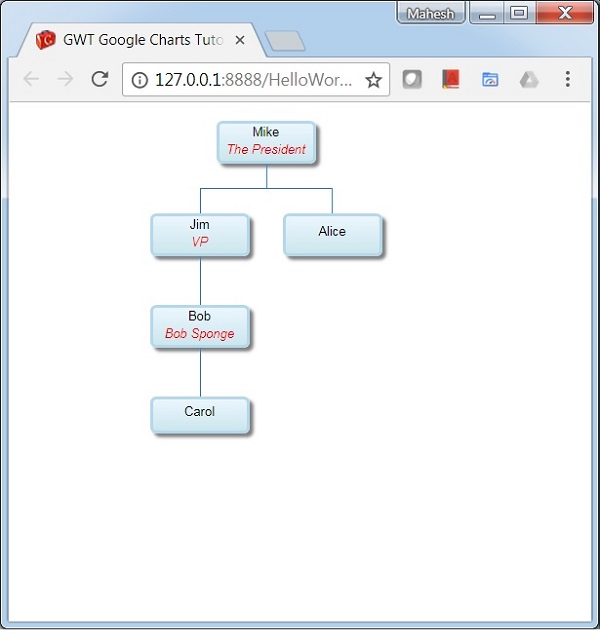
GWT Google Charts - 組織結構圖
下面是一個組織結構圖的示例。
組織結構圖有助於呈現節點層次結構,用於描繪組織中上級/下級關係。例如,家譜是一種組織結構圖。我們已經在 Google Charts 配置語法 章節中看到了用於繪製圖表所需的配置。現在,我們來看一個組織結構圖的示例。
配置
我們使用 **OrgChart** 類來顯示組織結構圖。
// Organization chart
OrgChart chart = new OrgChart();
示例
HelloWorld.java
package com.tutorialspoint.client;

import com.google.gwt.core.client.EntryPoint;
import com.google.gwt.user.client.ui.RootPanel;

import com.googlecode.gwt.charts.client.ChartLoader;
import com.googlecode.gwt.charts.client.ChartPackage;
import com.googlecode.gwt.charts.client.ColumnType;
import com.googlecode.gwt.charts.client.DataTable;
import com.googlecode.gwt.charts.client.format.PatternFormat;
import com.googlecode.gwt.charts.client.orgchart.OrgChart;
import com.googlecode.gwt.charts.client.orgchart.OrgChartOptions;

public class HelloWorld implements EntryPoint {
   private OrgChart chart;

   private void initialize() {
      ChartLoader chartLoader = new ChartLoader(ChartPackage.ORGCHART);
      chartLoader.loadApi(new Runnable() {
         public void run() {
            // Create and attach the chart
            chart = new OrgChart();
            RootPanel.get().add(chart);
            draw();
         }
      });
   }
   private void draw() {
      // Prepare the data
      DataTable dataTable = DataTable.create();
      dataTable.addColumn(ColumnType.STRING, "Name");
      dataTable.addColumn(ColumnType.STRING, "Manager");
      dataTable.addColumn(ColumnType.STRING, "ToolTip");
      dataTable.addRows(5);

      dataTable.setValue(0, 0, "Mike");
      dataTable.setValue(0, 1, "");
      dataTable.setValue(0, 2, "The President");
      dataTable.setValue(1, 0, "Jim");
      dataTable.setValue(1, 1, "Mike");
      dataTable.setValue(1, 2, "VP");
      dataTable.setValue(2, 0, "Alice");
      dataTable.setValue(2, 1, "Mike");
      dataTable.setValue(2, 2, "");
      dataTable.setValue(3, 0, "Bob");
      dataTable.setValue(3, 1, "Jim");
      dataTable.setValue(3, 2, "Bob Sponge");
      dataTable.setValue(4, 0, "Carol");
      dataTable.setValue(4, 1, "Bob");
      dataTable.setValue(4, 2, "");

      PatternFormat format = PatternFormat.create("{0} {1}");
      format.format(dataTable, 0, 2);

      // Set options
      OrgChartOptions options = OrgChartOptions.create();
      options.setAllowHtml(true);

      // Draw the chart
      chart.draw(dataTable, options);
      chart.setWidth("400px");
      chart.setHeight("400px");
   }
   public void onModuleLoad() {
      initialize();
   }
}
結果
驗證結果。
廣告