- GWT Google 圖表教程
- GWT Google 圖表 - 主頁
- GWT Google 圖表 - 概述
- 環境設定
- 配置語法
- GWT Google 圖表 - 區域圖表
- GWT Google 圖表 - 條形圖
- GWT Google 圖表 - 氣泡圖表
- GWT Google 圖表 - 燭臺
- GWT Google 圖表 - 柱狀圖
- GWT Google 圖表 - 組合
- GWT Google 圖表 - 直方圖
- GWT Google 圖表 - 折線圖
- GWT Google 圖表 - 地圖
- GWT Google 圖表 - 組織
- GWT Google 圖表 - 餅圖
- GWT Google 圖表 - 桑基圖
- GWT Google 圖表 - 散點圖
- GWT Google 圖表 - 階梯區域
- GWT Google 圖表 - 表格圖表
- GWT Google 圖表 - 樹形圖
- GWT Google 圖表資源
- GWT Google 圖表 - 快速指南
- GWT Google 圖表 - 資源
- GWT Google 圖表 - 討論
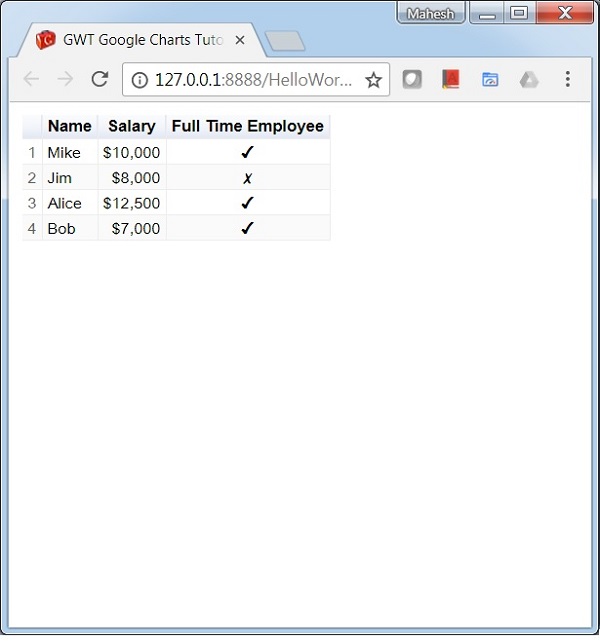
GWT Google 圖表 - 表格圖表
表格圖表有助於呈現一個表格,該表格可以進行排序和分頁。表格單元格可以使用格式字串進行格式化,或者直接插入 HTML 作為單元格值。數值預設右對齊;布林值顯示為對號或叉號。使用者可以使用鍵盤或滑鼠選擇單個行。列標題可用於排序。滾動時,標題行保持固定。表格觸發與使用者互動相對應的事件。
我們已經在 Google 圖表配置語法 章節中看到了用於繪製圖表的配置。現在,讓我們看一個表格圖表的示例。
配置
我們使用了 Table 類來顯示一個表格圖表。
Table chart = new Chart();
示例
HelloWorld.java
package com.tutorialspoint.client;

import com.google.gwt.core.client.EntryPoint;
import com.google.gwt.user.client.ui.RootPanel;

import com.googlecode.gwt.charts.client.ChartLoader;
import com.googlecode.gwt.charts.client.ChartPackage;
import com.googlecode.gwt.charts.client.ColumnType;
import com.googlecode.gwt.charts.client.DataTable;
import com.googlecode.gwt.charts.client.table.Table;
import com.googlecode.gwt.charts.client.table.TableOptions;

public class HelloWorld implements EntryPoint {
   private Table chart;

   private void initialize() {
      ChartLoader chartLoader = new ChartLoader(ChartPackage.TABLE);
      chartLoader.loadApi(new Runnable() {
         public void run() {
            // Create and attach the chart
            chart = new Table();
            RootPanel.get().add(chart);
            draw();
         }
      });
   }
   private void draw() {
      // Prepare the data
      DataTable dataTable = DataTable.create();
      dataTable.addColumn(ColumnType.STRING, "Name");
      dataTable.addColumn(ColumnType.NUMBER, "Salary");
      dataTable.addColumn(ColumnType.BOOLEAN, "Full Time Employee");
      dataTable.addRows(4);

      dataTable.setCell(0, 0, "Mike");
      dataTable.setCell(0, 1, 10000, "$10,000");
      dataTable.setCell(0, 2, true);
      dataTable.setCell(1, 0, "Jim");
      dataTable.setCell(1, 1, 8000, "$8,000");
      dataTable.setCell(1, 2, false);
      dataTable.setCell(2, 0, "Alice");
      dataTable.setCell(2, 1, 12500, "$12,500");
      dataTable.setCell(2, 2, true);
      dataTable.setCell(3, 0, "Bob");
      dataTable.setCell(3, 1, 7000, "$7,000");
      dataTable.setCell(3, 2, true);

      TableOptions options  = TableOptions.create();
      options.setAlternatingRowStyle(true);
      options.setShowRowNumber(true);

      // Draw the chart
      chart.draw(dataTable, options);
      chart.setWidth("400px");
      chart.setHeight("400px");
   }
   public void onModuleLoad() {
      initialize();
   }
}
結果
驗證結果。
廣告