- GWT Google 圖表教程
- GWT Google 圖表 - 主頁
- GWT Google 圖表 - 概覽
- 環境設定
- 配置語法
- GWT Google 圖表 - 區域圖表
- GWT Google 圖表 - 條形圖
- GWT Google 圖表 - 氣泡圖
- GWT Google 圖表 - 蠟燭圖
- GWT Google 圖表 - 柱狀圖
- GWT Google 圖表 - 組合圖
- GWT Google 圖表 - 直方圖
- GWT Google 圖表 - 折線圖
- GWT Google 圖表 - 地圖
- GWT Google 圖表 - 組織
- GWT Google 圖表 - 餅圖
- GWT Google 圖表 - 聖key 圖
- GWT Google 圖表 - 散點圖
- GWT Google 圖表 - 階梯區域
- GWT Google 圖表 - 表格圖表
- GWT Google 圖表 - 樹狀圖圖表
- GWT Google 圖表資源
- GWT Google 圖表 - 快速指南
- GWT Google 圖表 - 資源
- GWT Google 圖表 - 討論
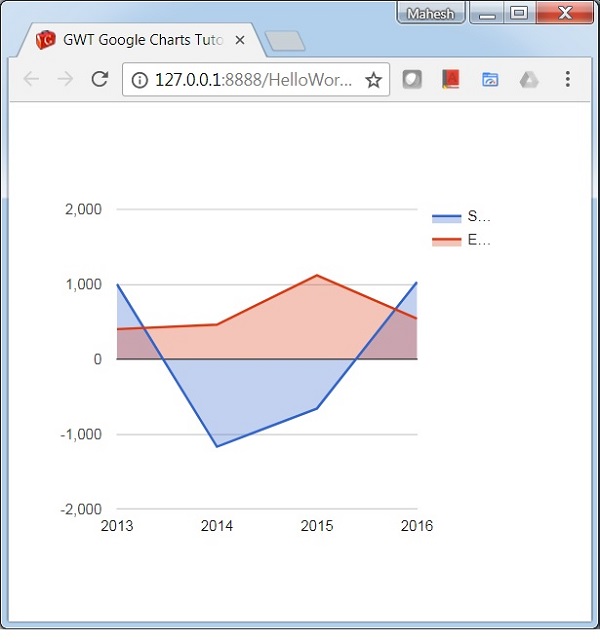
帶負值的區域圖表
下面是一個帶負值的區域圖表示例。
我們已經在 Google 圖表配置語法 章節中瞭解了用於繪製圖表的配置。現在,讓我們看一個帶負值的區域圖表示例。
配置
我們已經使用 AreaChart 類來顯示帶負值的基於區域的圖表。
// area chart
AreaChart chart = new AreaChart();
示例
HelloWorld.java
package com.tutorialspoint.client;

import com.google.gwt.core.client.EntryPoint;
import com.google.gwt.user.client.ui.RootPanel;

import com.googlecode.gwt.charts.client.ChartLoader;
import com.googlecode.gwt.charts.client.ChartPackage;
import com.googlecode.gwt.charts.client.ColumnType;
import com.googlecode.gwt.charts.client.DataTable;
import com.googlecode.gwt.charts.client.corechart.AreaChart;

public class HelloWorld implements EntryPoint {
   private AreaChart chart;

   private void initialize() {
      ChartLoader chartLoader = new ChartLoader(ChartPackage.CORECHART);
      chartLoader.loadApi(new Runnable() {
         public void run() {
            // Create and attach the chart
            chart = new AreaChart();
            RootPanel.get().add(chart);
            draw();
         }
      });
   }
   private void draw() {
      // Prepare the data
      DataTable data = DataTable.create();
      data.addColumn(ColumnType.STRING, "Year");
      data.addColumn(ColumnType.NUMBER, "Sales");
      data.addColumn(ColumnType.NUMBER, "Expenses");

      data.addRow("2013", 1000, 400);
      data.addRow("2014", -1170, 460);
      data.addRow("2015", -660, 1120);
      data.addRow("2016", 1030, 540);

      // Draw the chart
      chart.draw(data);
      chart.setWidth("400px");
      chart.setHeight("400px");
   }
   public void onModuleLoad() {
      initialize();
   }
}
結果
驗證結果。
gwt_googlecharts_area_charts.htm
廣告